Go to the makecode.microbit.org website and create a new project.
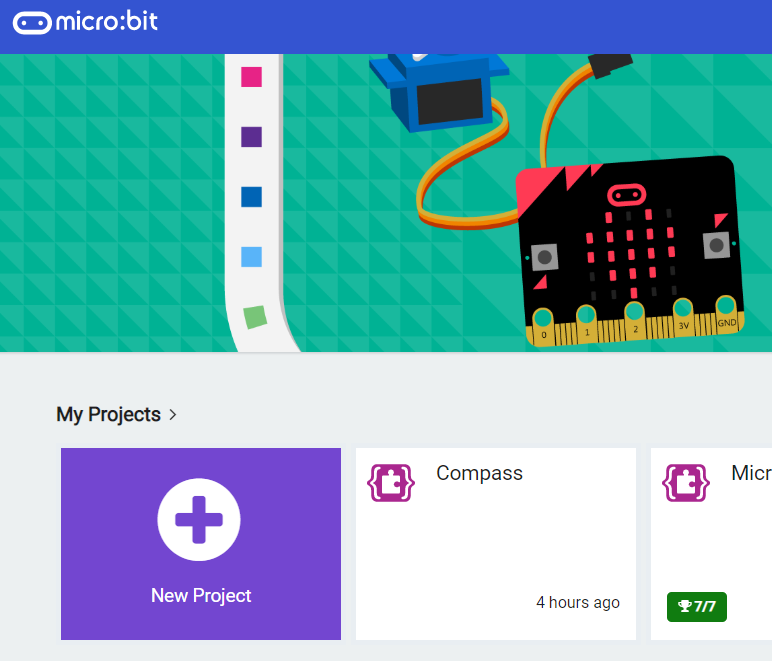
Go to the Makecode.com Microbit website using the link below and click on the 'New Project' button underneath the 'My Projects' heading.
https://makecode.microbit.org/
Install the micro:bit app on your iPad or tablet.
Open the app, tap 'Create code' and then create a new project.
The first sensor that we'll look at is the light level sensor. This senses how much light from the surrounding environment is hitting the front of the Microbit.
This number can be between 0 (black) and 255 (white).
Let's display the light level on the Microbit now.
basic.forever(function () {
    basic.showNumber(input.lightLevel())
})
You can change the amount of light on the Microbit simulator by using the yellow/grey circle in the top left corner (watch the gif for this step).Make sure to download the code on to your Microbit to test it out for real by shining more/less light on it!
Give your project a name and send it to your Microbit by following these steps:
- Type "your project name" into the Project Name box.
- Connect your Microbit to your computer using the USB cable.
- Click the 'Download' button (a file called 'microbit-project-name.hex' will be downloaded to your computer).
- Open the folder on your computer where the file downloaded to.
- Right click on the file.
- Click Send To.
- Click Microbit.
- Power your microbit with a USB cable or battery pack
- Pair your microbit with your iPad/tablet (hold the A and B buttons and press and release the Reset button)
- Flash your project to your microbit
We'll now do something a bit more interesting using the light level. We can view the light level on a graph that will illustrate the changes in light.
basic.forever(function () {
    led.plotBarGraph(
    input.lightLevel(),
    255
    )
})
You can view the graph on the simulator on your computer (click the "show data" button under the Microbit). Change the light level on the Microbit simulator and see how the graph changes!
Then, download the code on to your Microbit.
Now, we are going to change the code to make use of the other sensors on the Microbit. After each step you can test your change on both the simulator and your Microbit after you download the code.
Try to think about what the "up to" value should be in the plot graph code block during each step. If you are unsure then you can just put in 1023 (this is the maximum the Microbit allows).
All of these sensor blocks can be found in the Input block section.
Steps:
- Graph the temperature (up to 50 for celcius, 120 for fahrenheit). You can cup the Microbit tightly in your hands to increase the temperature, however this may be quite slow. Try putting it next to something hot (not too hot!) like a radiator or a hairdryer.
- Graph the compass heading (up to 359).
- Graph the acceleration (in different directions, e.g. x-direction, y-direction, etc.)
- Graph the magnetic forces (only if you have some sort of magnet)
- Graph the sound level (up to 255) (only if you have the new V2 Microbit with the sound sensor)
basic.forever(function () {
    led.plotBarGraph(
    input.temperature(),
    50
    )
})


basic.forever(function () {
    led.plotBarGraph(
    input.compassHeading(),
    359
    )
})
basic.forever(function () {
    led.plotBarGraph(
    input.acceleration(Dimension.X),
    1023
    )
})

basic.forever(function () {
    led.plotBarGraph(
    input.magneticForce(Dimension.X),
    1023
    )
})
basic.forever(function () {
    led.plotBarGraph(
    input.soundLevel(),
    255
    )
})
There's possibly some other values that you can graph on your Microbit. Get creative and see what you can come up with!
Also, maybe you could make use of these sensors in other games/projects?
This lesson is copyright of Coding Ireland. Unauthorised use, copying or distribution is not allowed.