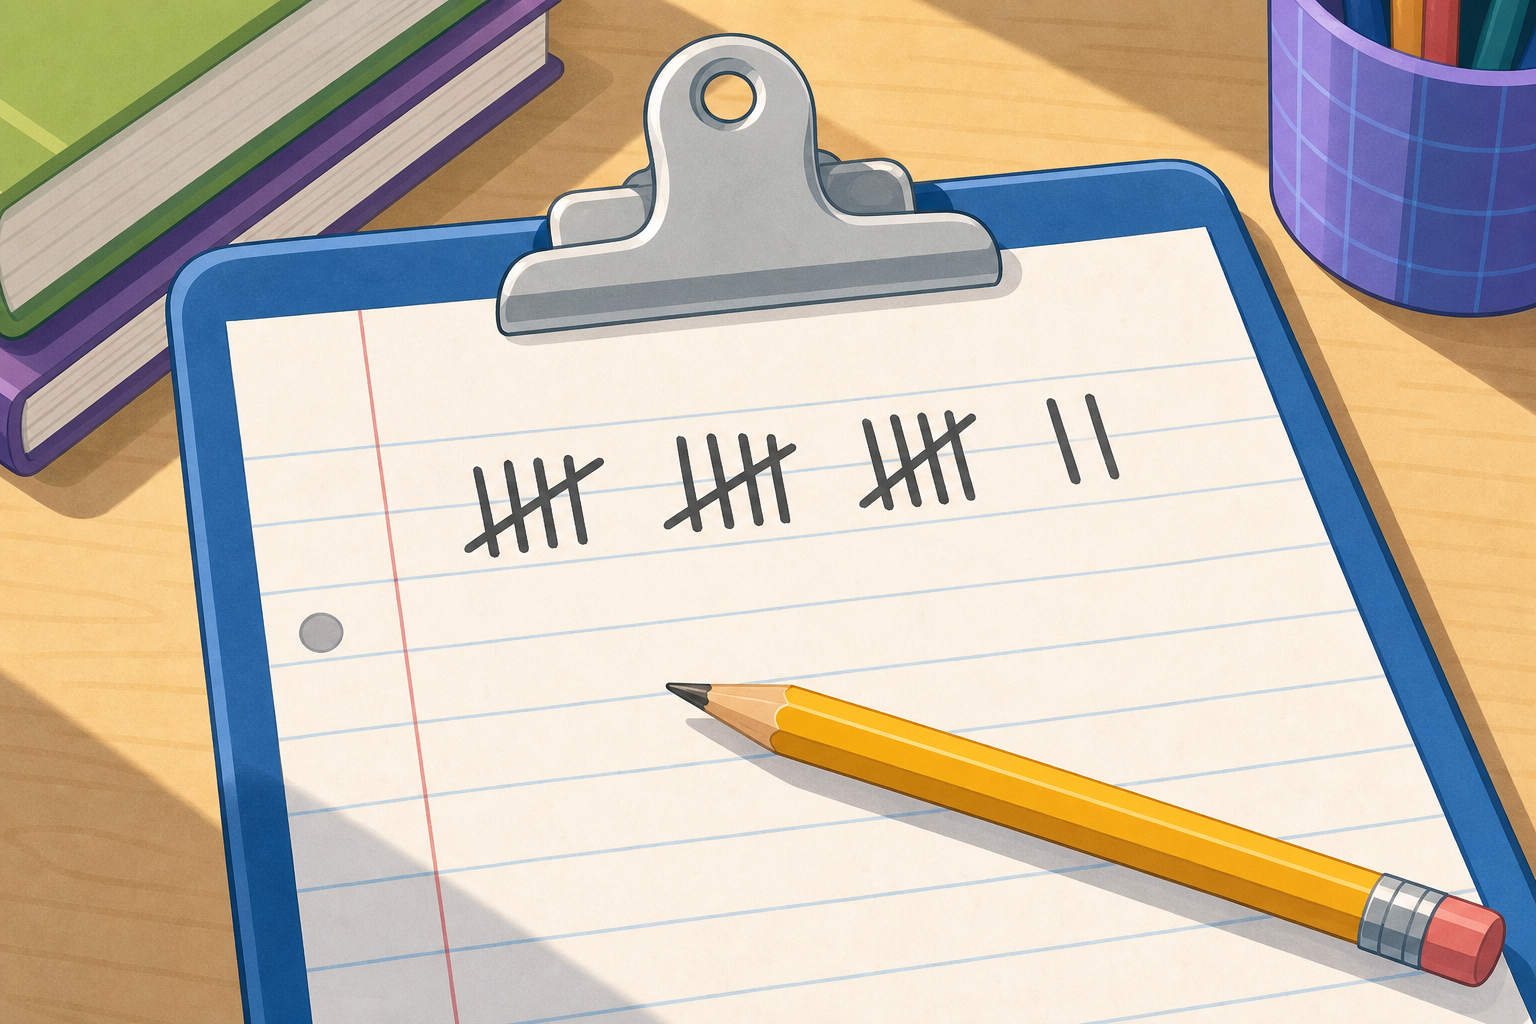
Here is a tally someone made on a clipboard. Count the marks: three full gates of five, then two more single strokes. How many is that altogether? And here are three questions a class might want to answer: "How do we get to school?", "What is your favourite colour?", "Will it rain tomorrow?" Which of these three could we actually answer by counting?
Take three hands-up answers for the tally count (the answer is 17). Then put the three questions to the class. Steer the talk toward which question we can settle by counting — the rain question is a prediction, not a count. Keep this brief; the sorting work happens in the next step.
We will draw a completed tally for how we get to school, sorted into Walk, Cycle, Bus and Car. Notice how every fifth mark crosses the other four to make a gate, and see how quickly the gates let us read a total.
Categories: Walk, Cycle, Bus, Car. One mark per child, fifth mark crosses the four as a gate.
Model the gate slowly: four strokes, then one, two, three, four, GATE as the diagonal fifth closes it.
Point at each gate, class chants five, ten, fifteen, then the spare strokes.
Strugglers: keep the drawn gate pattern visible as a prompt, say the rhythm aloud together.
Frequency table draws out: Walk 12, Cycle 5, Bus 8, Car 3. Read 12 as two gates plus two.
Pictogram is a preview only, do not work it out now: same data, one icon per child, the shape the answer takes later. Don't dwell.
No-gate example: six loose strokes, no grouping. Time the class counting these versus reading a gate. The slowness is why we cross every fifth mark.
Today we draft a brand-new question together: "What is your favourite playground game?" First we name the categories — call them out and we will write a row for each. Then individual pupils come to the board to add a tally mark in turn, and the whole class watches each fifth mark cross the four before it. The frequency column on the right fills in as we go.
Try Together: pupils take turns at the board and the class agrees or corrects out loud.
Hold the class to a tight category set (three to five named games) before any tallying starts — a question with too many categories never reads cleanly. Insist the diagonal lands on every fifth mark, not the sixth. Revoice a strong contribution: so each gate is worth exactly five. Watch for pupils who write a fifth straight stroke instead of crossing — catch it on the board the moment it happens.
Everyone writes this one in your own maths copy — nobody comes to the board for this part. Write your own question at the top, then list its categories, one per row. Draw a tally frame with a row for each category and add gate-marks as you imagine the votes coming in. Then, in a column to the right, convert each row's tally into a frequency (the total count) for that category.
Copybook moment: the board is paused and every pupil writes in their own copy at the same time. Walk the room glancing at two things only: the fifth-mark crossing on each gate, and that the frequency number matches the marks. No marking and no board turn-taking — this is whole-class copybook practice, not assessment.
Today we do some real counting together. First we find a good spot to watch from — the classroom window is perfect. Then we pick a question that fits what we can see, like "What colour are the cars going by?" or "What colour jumpers are people wearing?" We tally what we see in fives for a couple of minutes, then bring our count back to the board and read off the frequency for each group together from the tally chart.
Run this as a brief at-the-window count from pupils' seats — nobody leaves the room. Give the class about two minutes to tally one question (car colours, jumper colours, vehicle types) onto a chosen set of three or four categories, then call it and move to the board.
On the board, use the tally chart to read the frequency aloud as a class for each group. As a quick check, ask the class to compare the board frequencies against the gates shown, and confirm the totals together. This keeps the read-back active without leaving seats.
If the view is poor, drop the window count and just read the Walk/Cycle/Bus/Car chart on the board, asking pupils to call the frequency for each row.
What makes a question one we can answer with data, and one we cannot? And why does counting in fives help us read a tally so fast?
Listen for pupils naming the difference between a countable question (settled by tallying into categories) and an opinion or a prediction. Revoice: so a data question is one where we can sort every answer into a clear box and count it.
On the fives point, draw out that a gate of five is read in one glance, so a tally with gates is far faster than a row of loose strokes — link it back to the no-gate non-example from Watch and Notice.
Later in this unit we take a frequency table like the ones we built today and turn it into a bar chart, so the answer to our question becomes a picture anyone can read at a glance.
Keep this short. The tally-to-frequency skill from today is the input for the bar-chart lesson later in this unit, so leave the class confident that they can read a tally fast.
You're previewing this lesson. Get full access to this lesson and hundreds more — each one ready to teach, with interactive activities, printable resources and pupil progress tracking built in.