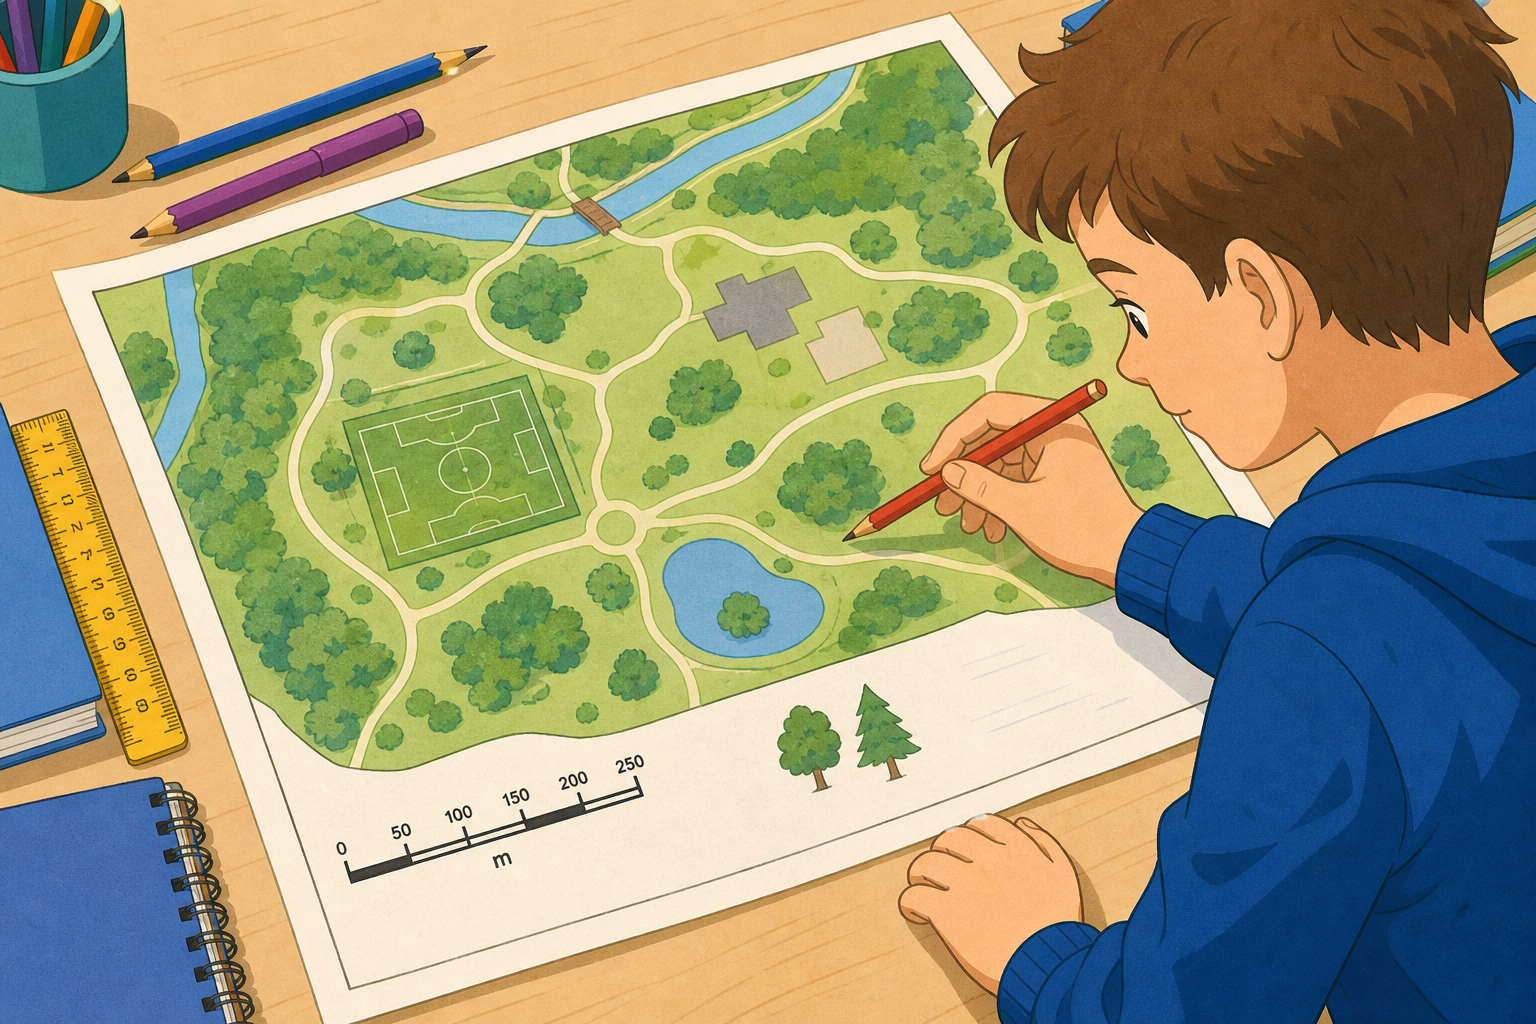
Look at this map of a local park. Down in the corner there is a little scale bar. A scale bar is a small ruler-like marker on a map that shows how much real distance a short paper length stands for. Two trees are drawn close together on the paper, but in real life they might be far apart. How could that tiny scale bar tell us the real distance between the two trees without ever walking it?
Display the park-map image with the scale bar visible and give five seconds of quiet think-time before any hands go up. Take two or three hands-up answers, not open call-outs. You are only fishing for the idea that the scale bar links paper distance to real distance — do not resolve the maths yet.
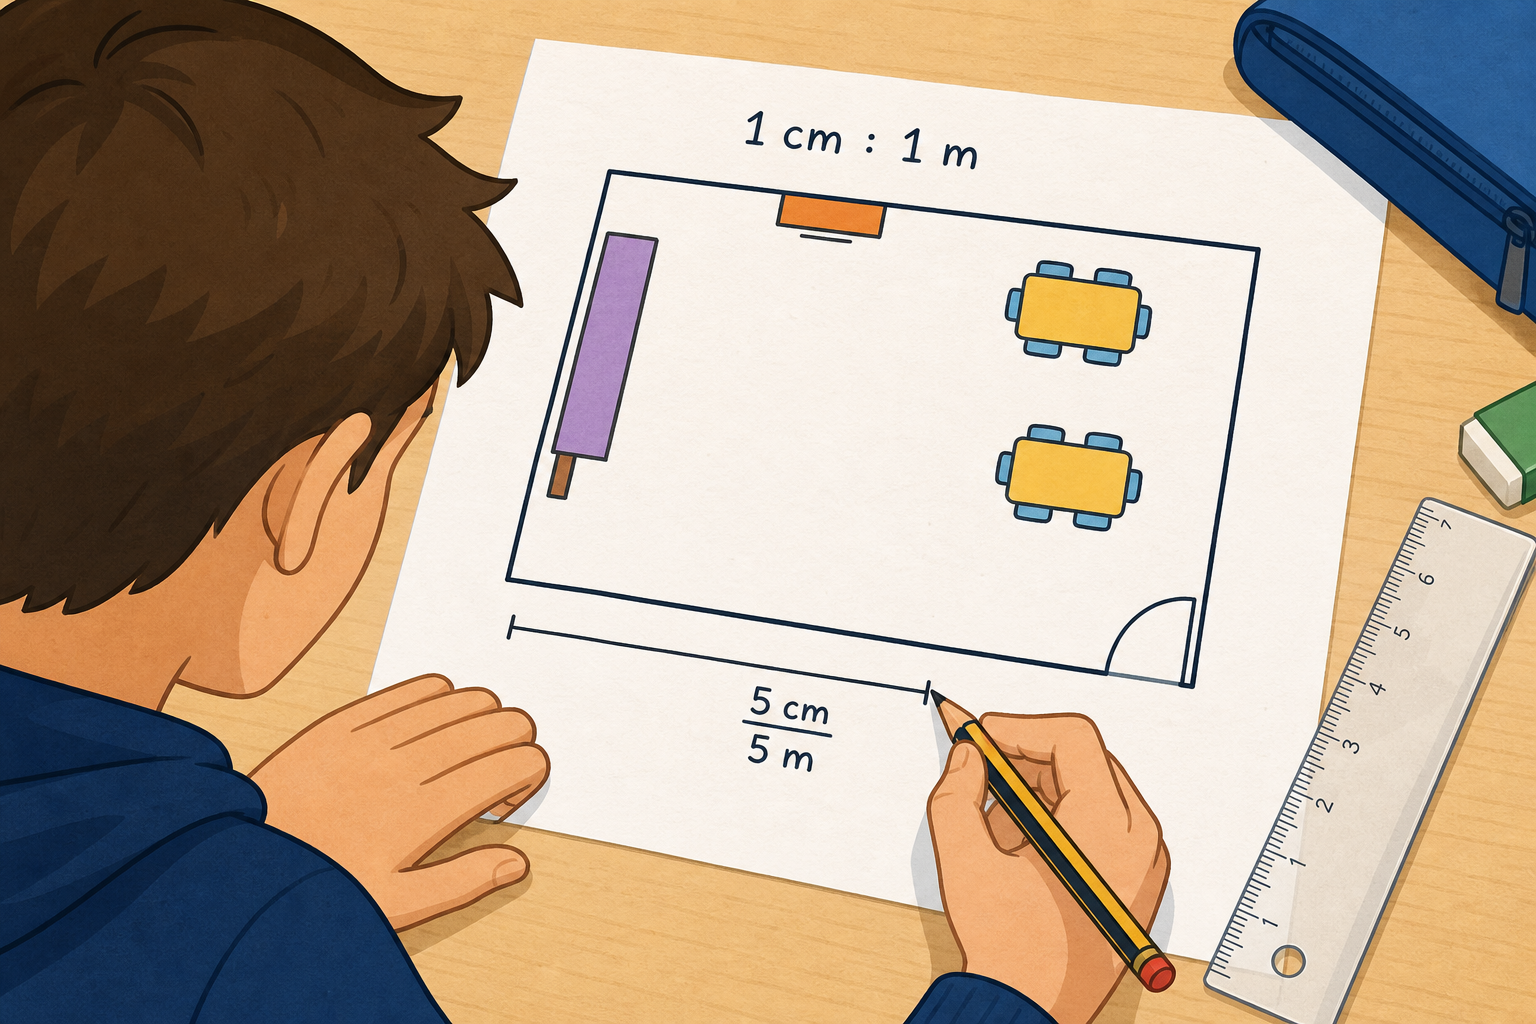
Look at this classroom plan. It shows paper lengths and the scale above it. The same rule turns each paper length into a real distance.
This plan is drawn at 1:100, so one cm on the plan stands for 100 cm, which is one metre, on the ground. The rule never changes: paper length × scale number = real length. Before we check together, can anyone tell me how far 4 cm on this plan would be in real life?
Rule stays fixed throughout: paper length times scale number equals real length. Keep place-value talk (times 100 means two zeros) for yourself, not the screen.
Classroom 1:100 — 1 cm on page is 100 cm, one metre, on ground. Plan is 5 cm by 3 cm, so real room 5 m by 3 m. Pull the room in early: if a wall is 4 cm on the plan, how long really? Take two hands before saying 4 m.
Treasure map — 1 cm on page is 10 m on ground; link 10 m back to 1000 cm so the colon ratio 1:1,000 makes sense. For example, 4 cm is 4 times 10 equals 40 m.
Ordnance Survey 1:50,000 — 1 cm is 50,000 cm, half a kilometre. Ask how far 2 cm is, take two hands, then reveal 2 cm times 50,000 equals 100,000 cm equals 1 km. Stress the rule never changes even when numbers get huge.
Today we work through this together: convert each wall of a real classroom into a plan at 1:100. We measure a wall in real life, divide by the scale, and write the paper length. Then we sketch the plan on the board as a class.
This round is for talking it through together — pupils take turns at the board and the class agrees or corrects out loud.
Use a stated 6 m × 5 m room (or measure the longest wall and the width to the nearest half-metre). Work the conversion out loud, showing the division each time: 6 m = 600 cm, 600 ÷ 100 = 6 cm on the page; 5 m = 500 cm, 500 ÷ 100 = 5 cm. Sketch the plan on the board as pupils call out each scaled length. The focus is the real-to-paper arithmetic and the scale drawing, not plotting points on a grid. Watch for the common slip of dividing the metres straight away without changing to centimetres first; reconcile that aloud as it comes up.
In your maths copy, sketch a scale plan of the classroom we just worked through at 1:100 — one cm on the page stands for 100 cm, which is one metre, in real life. Label each side in both paper units (cm) and real units (m), and write the scale (1:100) clearly above your drawing.
Walk the room glancing for the scale written above the plan and for both units labelled on each side — no individual marking, this is whole-class copybook practice. This keeps the same 1:100 metres-to-centimetres conversion the class has just rehearsed. Catch pupils who divide the metres without changing to centimetres first, or who drop the real-unit label.
Groups of four or five, one metre stick, copybook and pencil per group. Work wherever your school has a long wall — corridor, hall, covered area, or the classroom itself. Before the lesson, choose one long wall for each group to measure.
If you cannot use a corridor or hall wall, run the same measure-divide-draw task on the longest classroom wall instead.
Keep the active portion to one measurement so the minutes are realistic with a mixed-ability class. Groups of four or five, one metre stick per group. Use wherever the school has a long wall — corridor, hall, covered area, or the classroom itself. Pupils measure one real length, convert it from real to paper at 1:100, and sketch the plan. Finish with a short paper read-back in the reverse direction at the seats: given a labelled scale plan, multiply each paper length by 100 to find the real lengths. Stretch for fast finishers: a 4 cm × 3 cm rectangle at 1:25 — find the real perimeter only (length scales by the ratio; do not ask for area, which scales differently). Watch for the unit-matching slip (dividing metres without changing to centimetres) and reconcile it as you circulate.
Why do mapmakers use scale at all? What would go wrong if we tried to draw every map at full size?
Listen for pupils naming the practical problem — a full-size map of Ireland would be the size of Ireland and useless. Revoice a strong answer: so scale lets us shrink something huge down to a page while keeping every distance in the right proportion. Head off the idea that scale changes the real distances — it only changes how we draw them.
Next we turn our data-handling skills to drawing and reading bar charts, turning a tally of real class data into a chart we can read at a glance.
Recap the divide-for-paper, multiply-for-real rule once more before pupils move to the activity-book page.
You're previewing this lesson. Get full access to this lesson and hundreds more — each one ready to teach, with interactive activities, printable resources and pupil progress tracking built in.