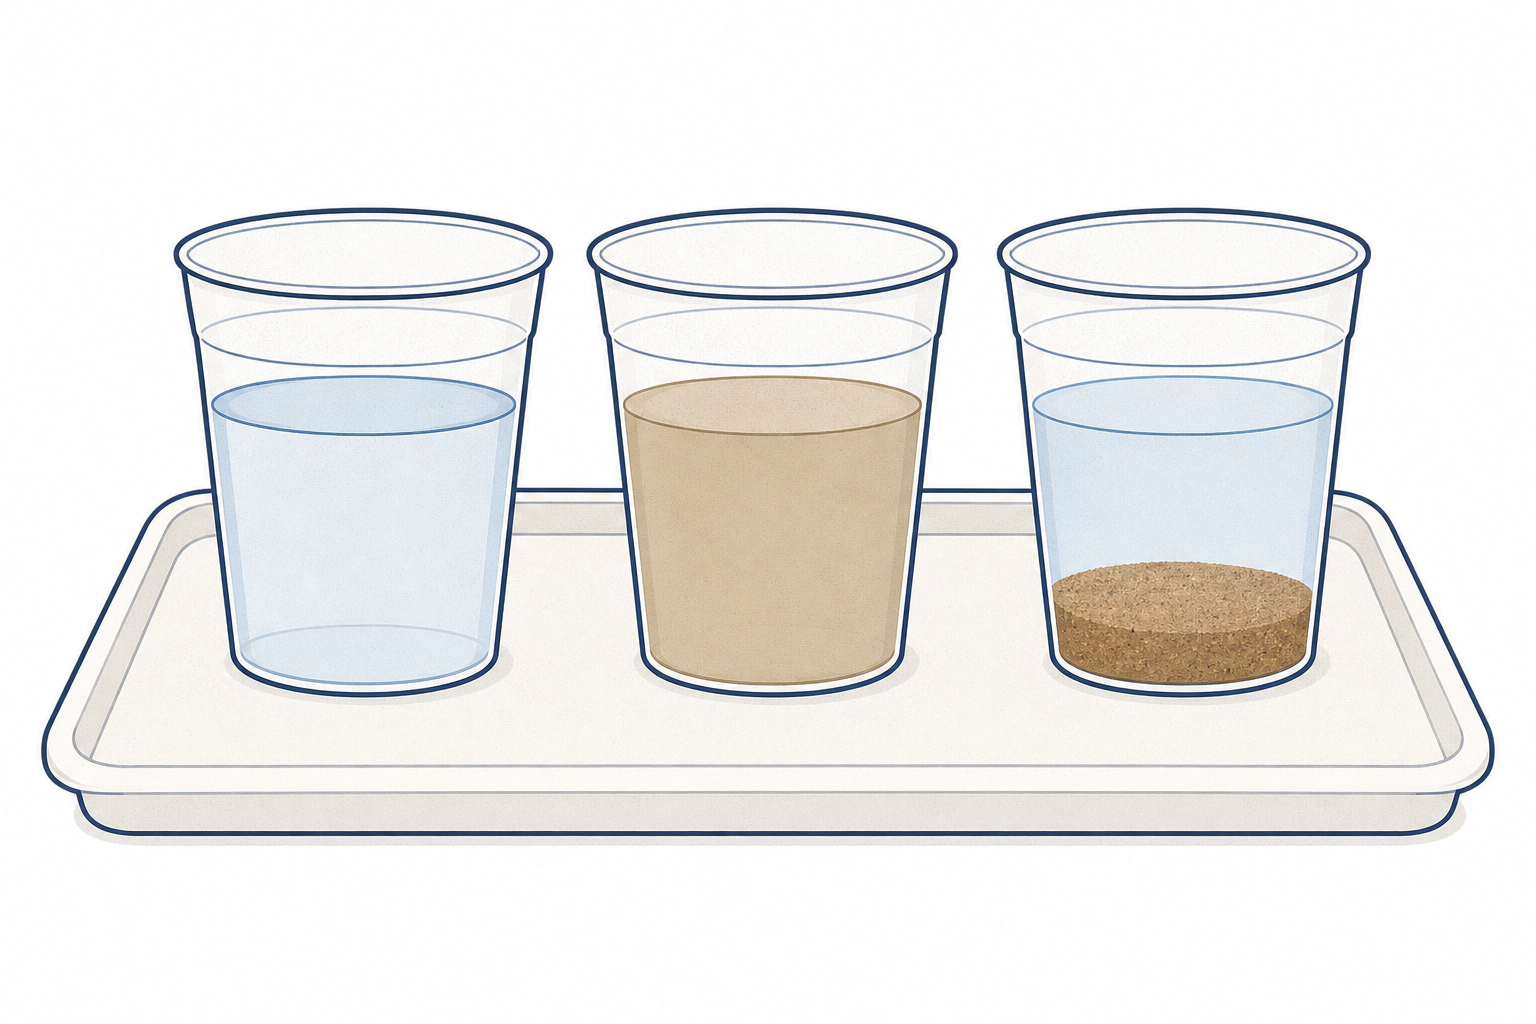
Open the results you recorded earlier in this project. Without saying which method you used, what stands out: which trial looked cleaner, and which still looked sandy?
Today we turn those readings into a class table and chart, read what the evidence shows, then each group improves its own method once and re-tests.
Keep this light. Do not rebuild the full apparatus yet. Ask pairs to glance at their first-trial readings only.
Key questions: Which of your readings looks best? Which looks worst? Are you looking at what you saw, or at what you hoped for?
Have the baseline jar idea from earlier in the project in mind if groups still have one standing: it is a useful comparison, not a new demo.
Before the lesson: gather the wet kit from Part 1; make sure each group can find its first-trial results on its Investigation Journal pages; print today's Investigation Journal page (for the class-chart sections in steps 2–3); have blank half-sheets ready for the re-test write-up in step 7; open the data-recorder interactive on the IWB.
We will build one class table of the first trials. Each group will call out its method and its sand-left score.
On screen the columns are Method and Sand left score (1–5). This is a judgment score we agree together so every group can share one comparable number. Score 1: you can read print through the cup. Score 3: cloudy like weak tea. Score 5: you cannot see a spoon behind the cup. Lower bars mean cleaner water.
If your group recorded millimetres last time, ask before you call out — we will map that reading onto the same 1–5 anchors together so every group still contributes one number.
Drive the data-recorder on the IWB in explore mode. Pupils do not type on devices; they call out and you enter (or a trusted pupil types under your lead). Keep stage directions about who types off the board text.
How to score if groups used different measures last time: agree a shared 1–5 cloudiness scale for the chart so every group can contribute one comparable number. Anchor the scale: 1 = print readable through the cup; 3 = cloudy like weak tea; 5 = spoon not visible behind the cup. If a group measured settled-sand depth in millimetres, help them map it roughly onto the same 1–5 scale for the class chart before they call out; they keep their original numbers on paper.
Spell out the interactive: two columns appear — Method, Sand left score (1–5). Add one row per group (the table holds up to twelve rows). When the table is full, show the bar chart. The last numeric column becomes one bar per row. If you somehow have more than twelve groups, pool pairs of same-method groups and note both scores in the Method cell, or average their shared 1–5 scores and say so aloud.
Investigation Journal (class-chart side): while or just after the chart is built, pupils complete today's Investigation Journal page sections that match this beat (class methods scores, which bar is lowest, which method left the least sand). That is what today's printed page is for. The before-and-after re-test write-up comes later on a separate half-sheet.
Look-fors: every group contributes one first-trial score; the class can name the lowest bar; nobody treats a single reading as "the truth" without the chart.
Misconception to head off: a tall bar does not mean "best". On this scale, tall means more sand left, so worse separation.
Leave the chart open on the IWB into the next step. Do not switch to a second slide — step 3 uses this same chart as its only board visual.
A single cup on your desk can fool you. Scientists trust the pattern across many results, and they separate what they saw from what they think it means.
Keep looking at the class chart on the board. Which method left the least sand? Which bars cluster together?
Look across the whole chart — that pattern is the evidence. When we change one thing and try again, that re-test lets us compare fairly. What must we keep the same if we improve a method and want a fair comparison?
Single-screen handoff: leave the data-recorder chart from step 2 open as the only IWB content. Do not project a separate key-concepts slide or board text that would replace the chart. Speak the short definitions from the table below after the class has answered the chart questions, so the words label thinking already done (e.g. name "pattern" only after they point at the lowest bars; name "evidence" when they say what the numbers show; name "re-test" when you turn to the fair-comparison question).
| Concept | Why it matters | Example |
|---|---|---|
| Pattern in the data — what the numbers show when you look across the whole table or chart | One lucky reading can mislead; the pattern across groups is what we trust | If most filtering rows score 1–2 and sieving rows score 3–5, the pattern says filtering left less sand |
| Evidence — what you measured or saw, used to answer the question | Scientists separate what they saw from what they think it means | "The water scored 2" is evidence; "so filtering is best for drinking water" is an inference that needs more care |
| Re-test — run the test again after changing one thing in the method | Engineers and scientists improve a method and check with new data, not just a new opinion | Filter twice instead of once, keep mixture amount and time the same, score cloudiness again |
Worked example (you model aloud; do not print the answer on the board before the class has read its own chart):
Nature of STEM: this is the Science ↔ Maths data bridge. A clear table and bar chart let the data do the talking before anyone redesigns the method.
Key questions: What did we see, and what do we think it means? Which claim can the chart support, and which claim goes too far?
Each group chooses one improvement to its own method from earlier in this project. Keep everything else the same: the amount of mixture, the time, the container, and how you score sand left.
Say your improvement out loud and predict: will the sand-left score go down, stay the same, or go up? Why?
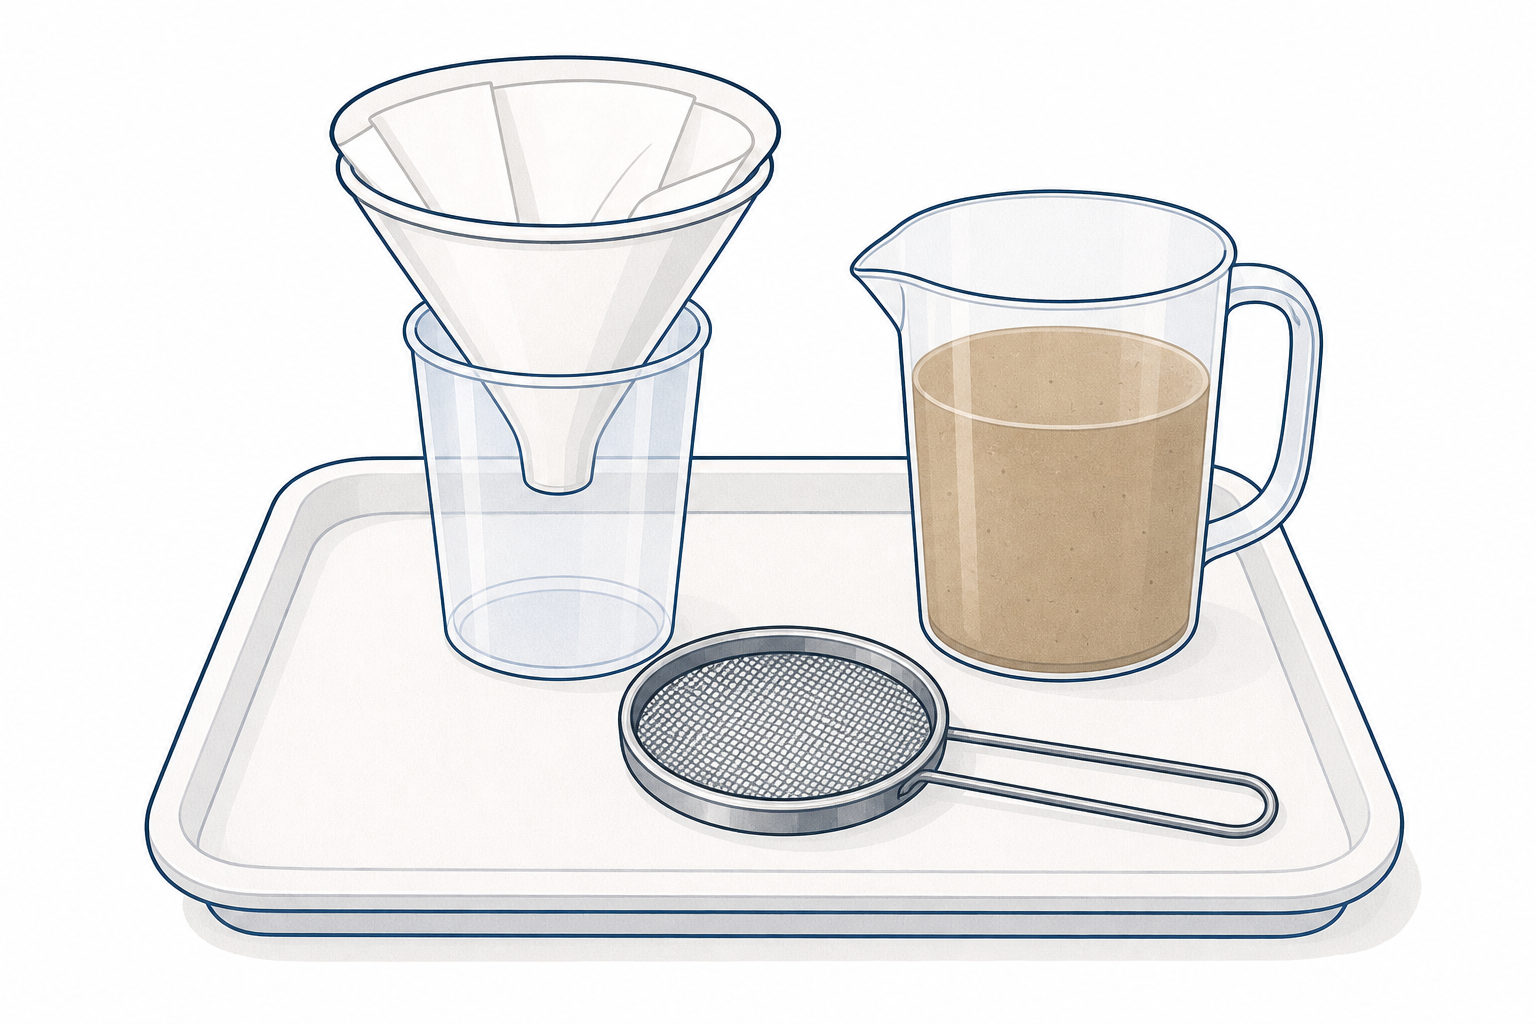
This is the child-led beat. Groups design the improvement; you only police fairness (one change only) and safety. Use the display prompts on the board to hold the talk structure.
Sensible improvement menus by method (offer as prompts, not a script):
Refuse changes that break the fair test (different mixture amount, different scoring rule, two changes at once). For settling, if the chosen wait is long, warn the group that one careful run is enough — there will not be time for a second improved run.
Prediction stem: "If we …, then the sand-left score will … because …" Predictions are not marked right or wrong.
Have the wet kit ready to hand out only after each group can name its one change and its prediction.
Run your improved separation once, carefully. Score sand left the same way as before. Take the reading after the run, not from memory of the first trial.
One careful improved run is enough. Only if you finish early and the teacher says there is time may you repeat the improved run and agree one score to keep.
Wipe spills as you go. Do not taste the water.
Groups use the same kit theme as earlier in the project. You prepare fresh sand–salt–water mixture so starting cloudiness is roughly even across groups.
Default success path: one careful improved run, then score. Do not frame a second run as expected. Settling groups that add wait time, or any group that resets after a spill, will need the full slot for a single clean run.
Fair-test checklist while you circulate:
What "good" looks like: pupils can point to the single thing they changed; they score after the run, not from memory of the first trial; they keep wet sand and dry scoring notes separate.
If a result goes wrong: a knocked cup is not a new method. Reset and repeat the improved run. Do not add a second improvement mid-trial. That reset counts as their one run path, not as an optional extra.
Optional second run only if time truly remains after scoring: if a group finishes early and both runs were clean, they agree one score to keep (they may choose the second if the first was messy, or pick the lower of the two). Do not ask for a "middle" of two numbers.
Differentiation: less confident groups pick a simple, visible change (pour more slowly; wait two more minutes). Confident groups may quantify more tightly (settled depth in mm) but still change only one thing.
You're previewing this lesson. Get full access to this lesson and hundreds more — each one ready to teach, with interactive activities, printable resources and pupil progress tracking built in.