Mathematics
Intermediate
50 mins
Teacher/Student led
+80 XP
What you need:
IWB/Projector/Large Screen

Bar Charts: Choosing a Scale

Learn how to choose the right y-axis step for a bar chart so the tallest bar fits without cramping the shorter ones. Compare different scales and decide which tells the story best.
Teacher Class Feed

Load previous activity

    1 - Getting Started ~4 mins

    Here is a bar chart of how many points four players scored last season. One player scored 30 points; the other three scored much less.

    Look at the tallest bar. What has gone wrong with this chart, and what would you change to fix it?

    2 - Watch and Notice ~8 mins

    Here is the same set of points (4, 6, 30, 8) drawn three times. Only one thing changes each time: how much each gridline is worth going up the side.

    Look at all three together. One of these charts makes your eyes work far too hard, so see if you can spot which one! Which is fiddly to draw? Which squashes the short bars? Which lets you read every bar at a glance?

    3 - Try It Together ~10 mins

    Today we work with the goals four teams scored in a blitz: 25, 5, 3, 7. We'll build the bars on the board first. Then, on the same builder, we'll change the step to 2, then to 5, then to 10, and watch how the same data looks each time. Together we'll decide which step tells the story best.

    Goals in the blitz

    4 - Redraw It in Your Copy ~2 mins

    COPYBOOK MOMENT

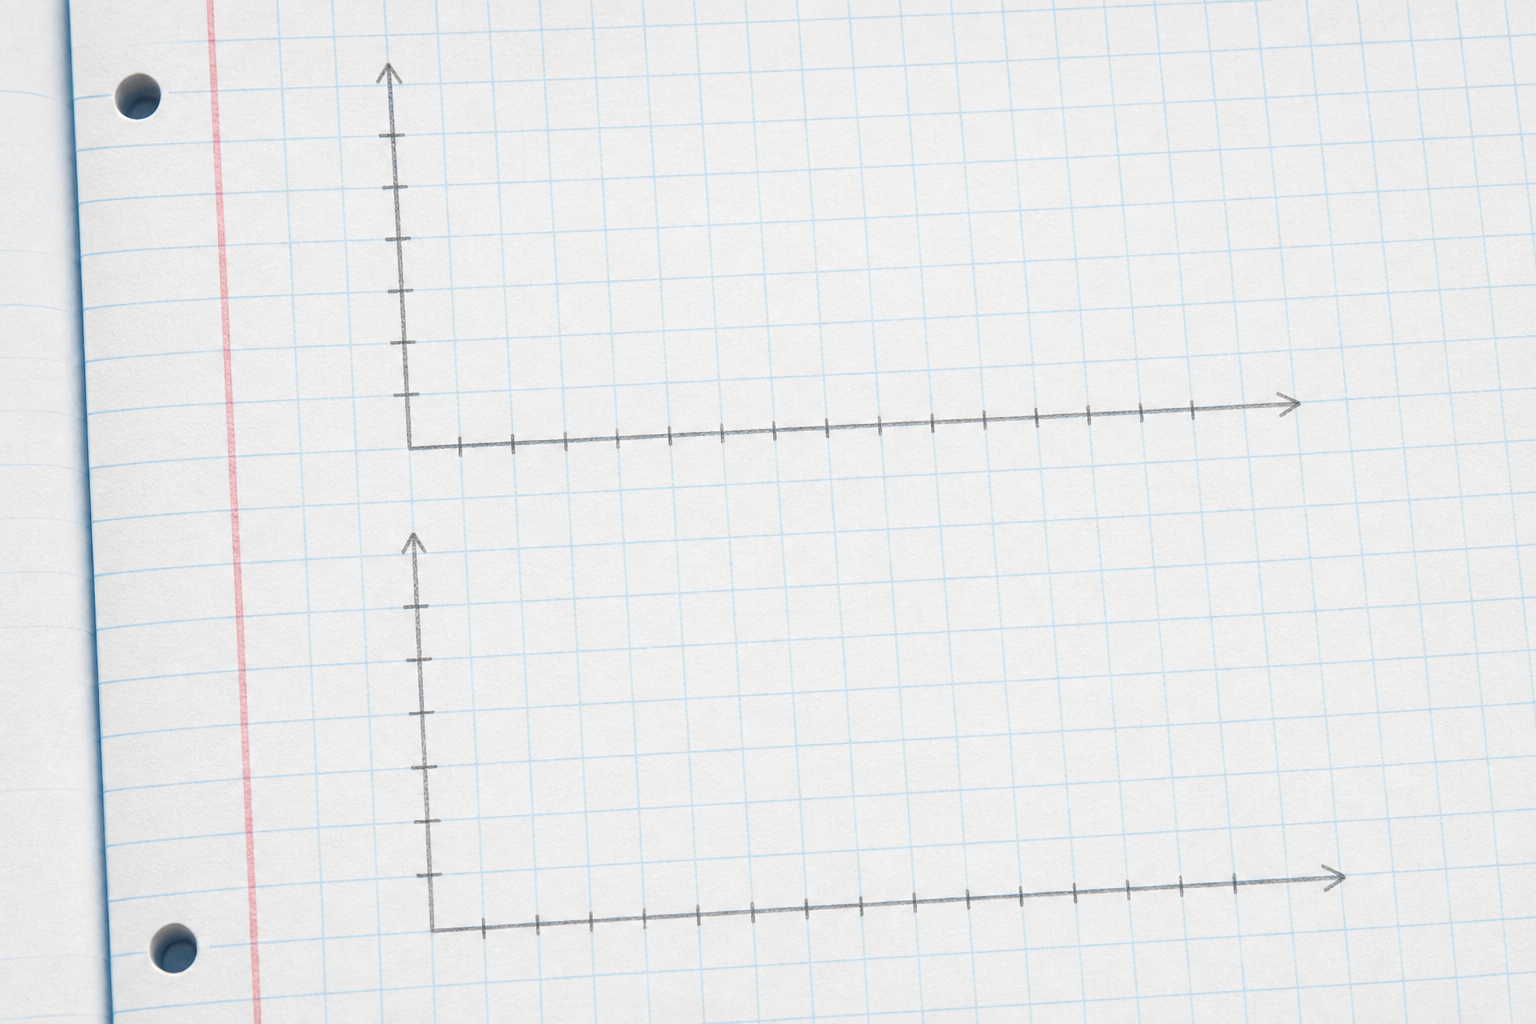
    Illustration for Redraw It in Your CopyOn your own squared paper, rule two small grids side by side. Use the blitz goals from a moment ago: Reds 25, Blues 5, Greens 3, Golds 7. On the first grid, mark the up-the-side lines at a step of 1; on the second, mark them at a step of 5. Draw the same four bars on both. Underneath, write one sentence saying which scale tells the story best and why.

    5 - Class Challenge ~8 mins

    Now some quick building practice. All five charts share one grid, marked in fives up to 60, so you can plot fast and read the scores at a glance. First a friendly with small, close scores. Next a game where one team pulled a little ahead. Then a match where one team ran away with it. After that, the county final, where every team scored big. Last of all, a tight game where all four teams land on two consecutive bands, so you have to look carefully. Build each chart to match the numbers, then check.

    Build each match chart

    Pupil practice
    Module 7 · Data, Chance and the Co-ordinate Plane Data & Chance
    Lesson 88 · Bar Charts: Choosing a Scale
    Download Activity Book page (PDF)
    123learn · Online learning platform

    Unlock the full learning experience

    You're previewing this lesson. Get full access to this lesson and hundreds more — each one ready to teach, with interactive activities, printable resources and pupil progress tracking built in.

    Hundreds of curriculum-aligned lessons
    Interactive activities in every lesson
    Printable resources & progress tracking
    Copyright Notice
    This lesson is copyright of Coding Ireland 2017 - 2025. Unauthorised use, copying or distribution is not allowed.
    🍪 Our website uses cookies to make your browsing experience better. By using our website you agree to our use of cookies. Learn more
