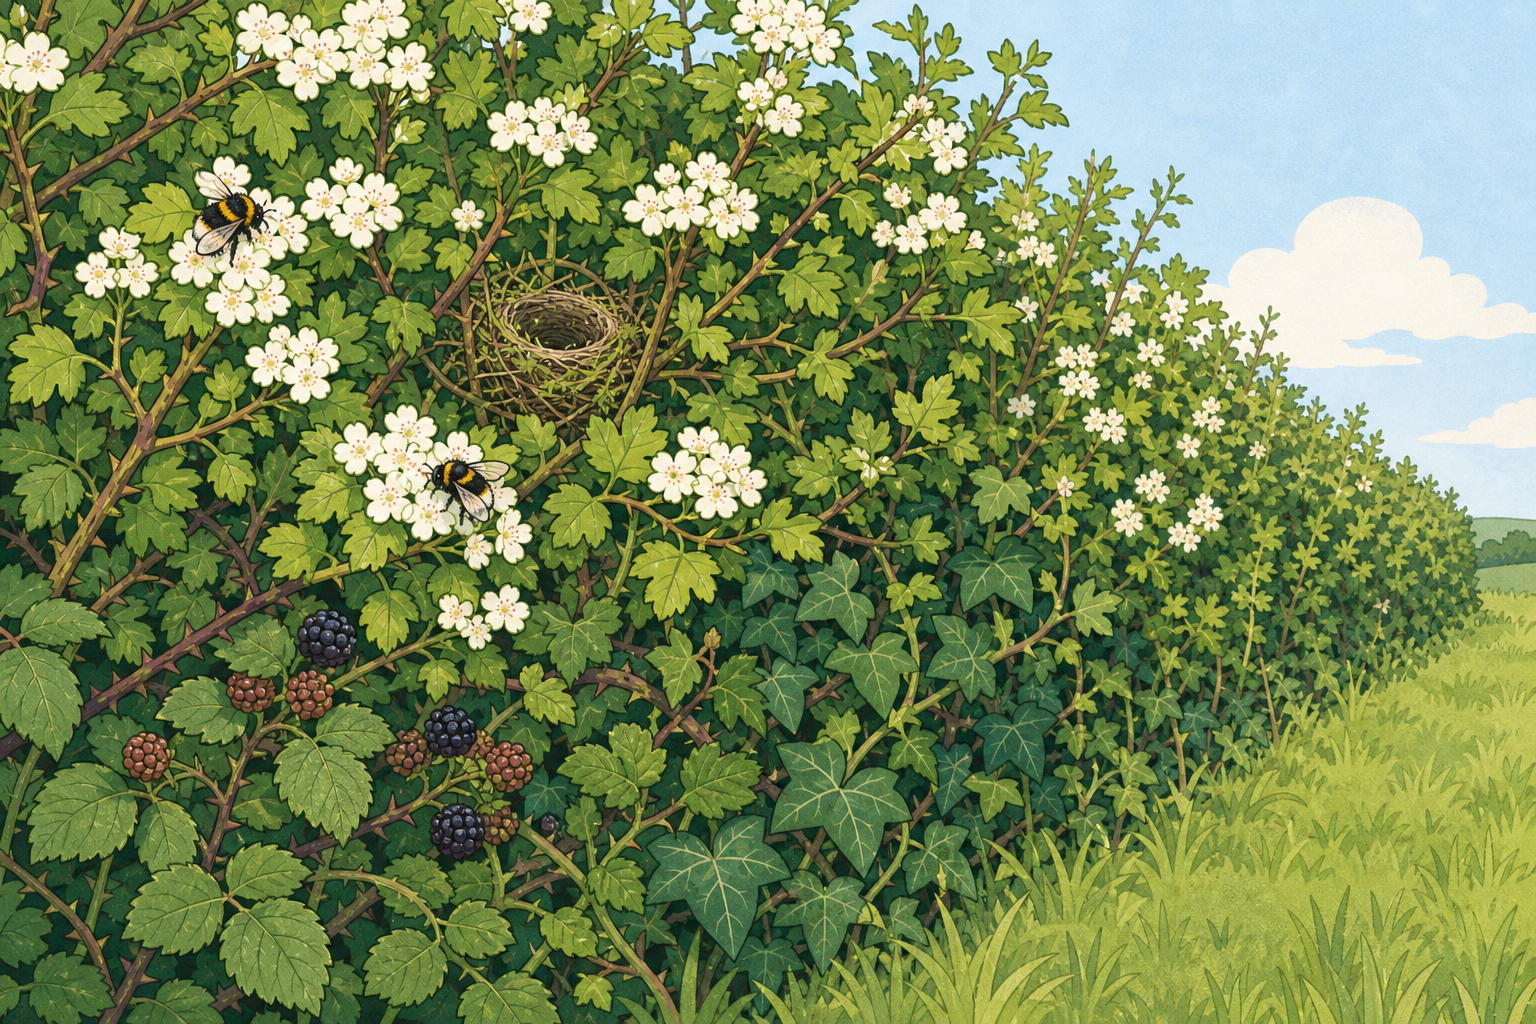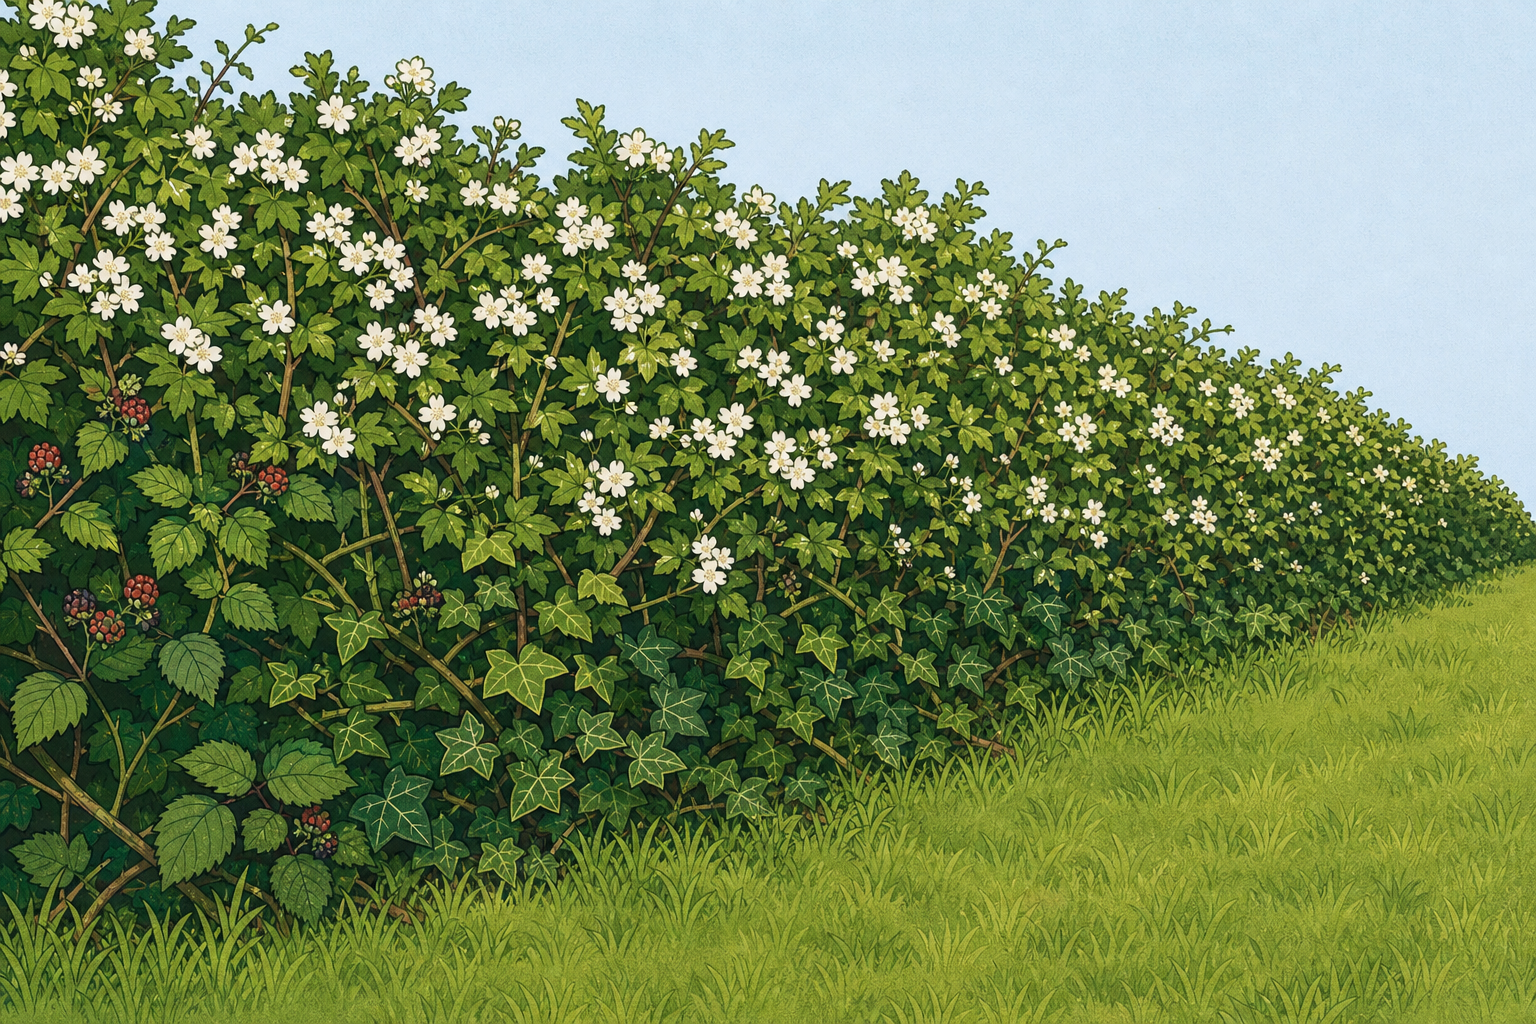
Imagine a thick Irish hedgerow full of flowers, bees and birds. One season it is cut away to make a wider field edge. What do you think happens first to the living things that used that hedge?
Hands up: which living thing do you think would feel the change soonest, and why?
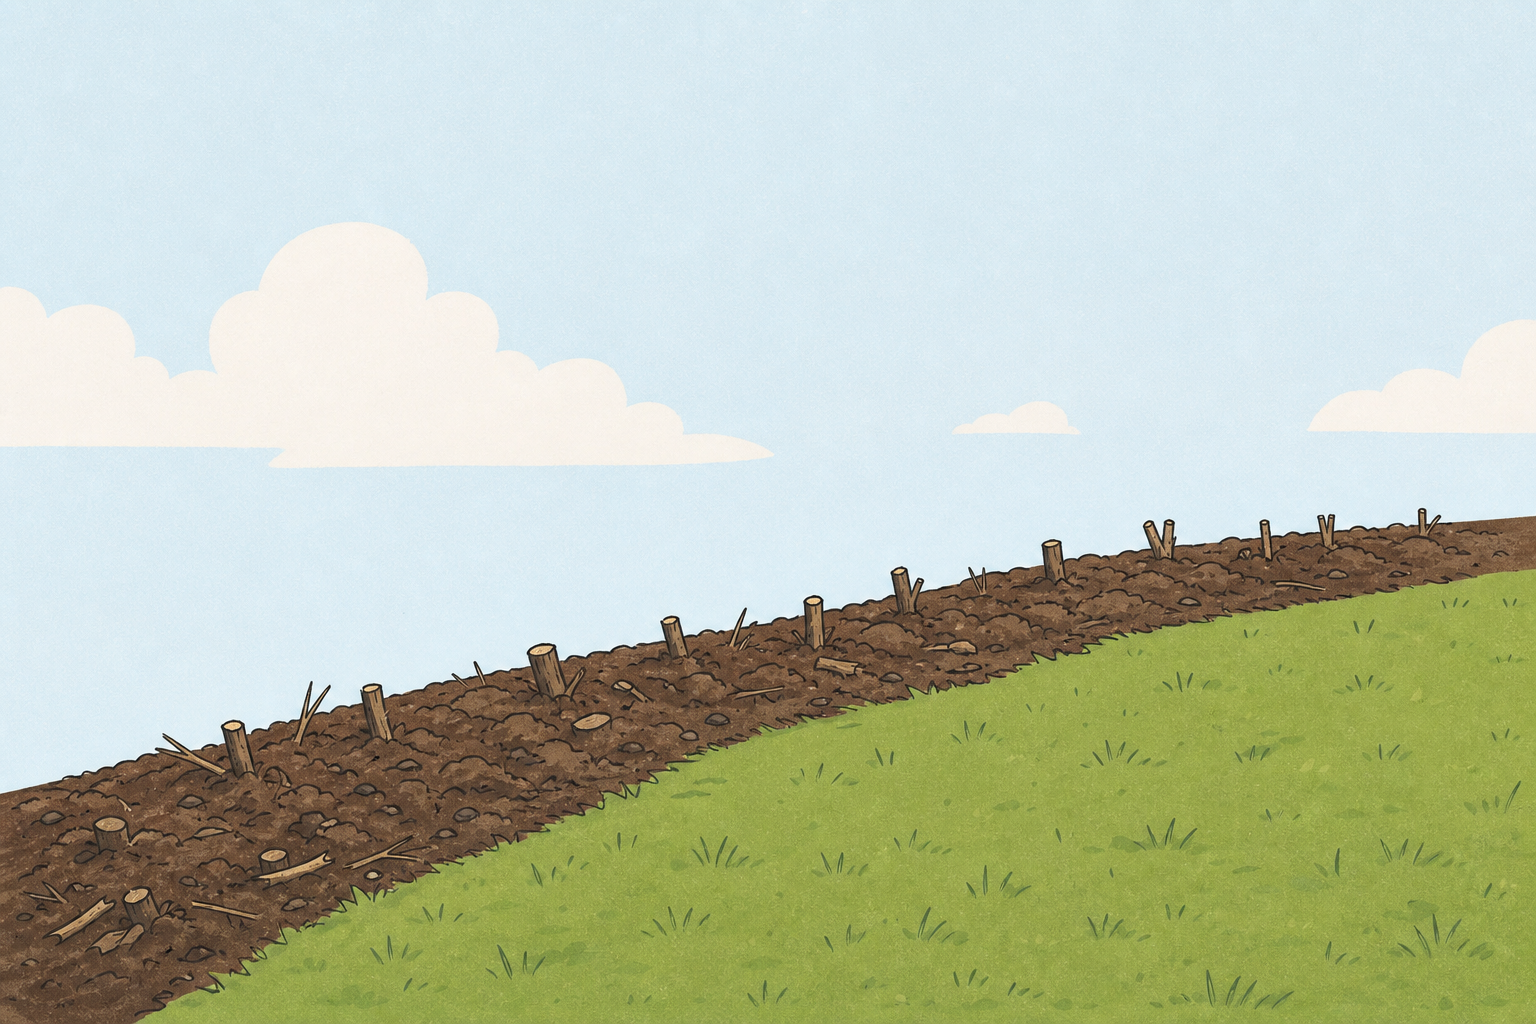
Keep this as a curiosity beat only. Do not hand out count cards or open the data interactive yet. Invite three or four quick guesses and leave disagreement hanging.
Link to the project: remind the class that they already built food chains and a simple web from their school-grounds survey earlier in this project. Today they will use that kind of thinking on an Irish habitat change.
Key question: If one part of a habitat changes, does only that part feel it, or do others feel it too?
Today's big question: when a farm hedgerow is removed, which living things on the food web are likely to drop, and how might one drop lead to another?
With your group, look at the hedgerow food web at the top of your Investigation Journal page. We will study example before-and-after counts for a typical Irish farm hedgerow removal.
First: name which living thing you think will feel the change first, and why it links to the hedge. Then: say who might feel it later, and why.
The hedgerow food web is printed at the top of every pupil's Investigation Journal page — nothing to draw or retrieve. It uses the same living things as the count cards, so every arrow can be checked against a card:
Arrows point from the food to the feeder. Project a blank journal page, or copy the five links onto the board, if you would rather work from one shared web.
Before the bell: hand out the journal pages so the web is in front of every group as they sit. If your class kept its own group webs from earlier in this project, display those alongside as a bonus.
| Concept | Why it matters | Example |
|---|---|---|
| Habitat change — something important about a living place is altered | Irish wildlife often depends on hedges, bogs and flower-rich edges that people change | A hedgerow is removed to widen a field edge |
| Knock-on effect — a change to one living thing leads to changes for others that depend on it | Protecting one link can protect several others further along the chain | Fewer flowers means fewer bees, then fewer insects for some birds |
Teacher background only (do not put on the pupil board): interdependence means living things rely on one another and on their surroundings. Use it to guide your prompts; keep pupil talk to habitat change and knock-on effects.
Board version only: keep the pupil screen short (already in description). Do not project this table.
Prediction stems (in this order): I think ___ will feel it first because ___. Then: I think ___ might feel it later because ___.
Misconception to head off: children may say only the plants disappear and everything else is fine. Push gently: what ate the plants? What ate those animals?
Nature of STEM: this is how people who care for Irish wildlife work. They look at counts before and after a change, then decide what to protect next. Hedgerow and pollinator loss are live Irish issues; the card numbers are example counts that show the kind of pattern surveyors record.
Each group has a set of example before-and-after count cards for a typical Irish farm hedgerow removal. Read them carefully. Do not rush to the answer.
For each row, notice the number before the hedge was removed and the number after. Talk quietly: which drops match your prediction? Which surprise you?
Print one full set of cards per group. Pupils read evidence first; charting comes next. Circulate and ask: What does the card show, not what do you wish it showed?
Title card: Example before-and-after counts for a typical Irish farm hedgerow removal. Counts like those wildlife surveyors might record for the same kind of patch before and after the hedge was cut away.
Card A — Flowering hedge plants (hawthorn and bramble): Before: 14 clumps in the patch. After: 0 clumps. Note: the green structure and flowers are gone.
Card B — Bees and bumblebees: Before: 32 counted on a warm afternoon. After: 7 counted in the same way on a similar afternoon.
Card C — Butterflies: Before: 18. After: 4.
Card D — Small birds (robin, wren, thrush): Before: 9 birds using the patch. After: 2 birds seen using the open edge.
Card E — Caterpillars and aphids: Before: 45 on leaves and stems. After: 12 on leftover weeds and grass.
Card F — Hedgehog signs (tracks or visits): Before: 3. After: 0.
Teacher answer key (do not print for pupils): Biggest first losses tend to be the plants themselves. Plant-feeders and flower-visitors (bees, butterflies, many caterpillars and aphids) tend to drop next. Animals that nested, sheltered or hunted along the hedge (small birds, hedgehogs) often drop as well. Exact order can be debated. The cards show who dropped and by how much, not a timed sequence. Pupils use the food web to reason a likely knock-on order. The point is linked drops, not a single victim.
Look-fors: groups point at numbers; they separate observation ("bees went from 32 to 7") from inference ("so bees lost food and shelter").
We will put the card numbers into the interactive table on the board so the whole class can see the pattern.
Six rows from the cards appear in the table. We type the Before count and the After count for each one. Then we show the bar chart of the after counts and compare it with the table.
Call out the numbers from your cards as we fill the table together.
Drive the data-recorder on the IWB in explore mode. Enter (or invite pupils to enter) exactly these rows from the cards:
The chart uses the last numeric column, so bars show the After counts. Use the table to compare before and after side by side; use the chart to ask which rows are left in the smallest numbers.
Questions while the chart is up: Which bars are shortest now? Who lost everything in this patch? Does the chart alone tell the full story, or do we still need the Before column?
If the interactive is unavailable: draw the same two-column table on the board and sketch simple bars for the after counts.
A knock-on effect is when one change leads to another. For example: hedge plants gone means bees lose food, so bee numbers can drop too.
Now use the hedgerow food web on your Investigation Journal page and the counts together. Start at the hedge plants. Follow the arrows to the living things that feed on them or use them for shelter. Then follow on to what eats those animals.
In your group, agree one knock-on chain: which link is likely to feel the change first, what might feel it next, and what evidence from the numbers supports that order. Be ready to share your chain with the class.
Investigation focus: predict-and-check against evidence, not a new outdoor survey. The cards show linked drops and how big they were. The likely order (plants, then plant-feeders and flower-visitors, then shelter-users and insect-eaters) comes from the food-web links and the fact that the plants were removed, not from a timed sequence on the cards.
Model one chain aloud if groups stall: hedge plants fall to zero → bees and butterflies lose flowers and drop sharply → caterpillars and aphids lose food plants → small birds lose food and nest cover → hedgehog signs vanish as shelter and hunting edges disappear. Invite challenge: could birds drop partly because insects dropped, not only because nests went?
Worked investigation cycle (teacher performs; do not print the answers on the board):
Fold watchers in: when one group shares at the front, ask the class: Do you agree with their order? What would you put first?
You're previewing this lesson. Get full access to this lesson and hundreds more — each one ready to teach, with interactive activities, printable resources and pupil progress tracking built in.