Mathematics
Advanced
50 mins
Teacher/Student led
+110 XP
What you need:
IWB/Projector/Large Screen

Class Survey: Pose, Collect, Summarise, Present

Run a complete survey from question to tally to bar chart to headline finding. Collect real data from your class, count it carefully, and discover what the numbers tell you.
Teacher Class Feed

Load previous activity

    1 - Getting Started ~4 mins

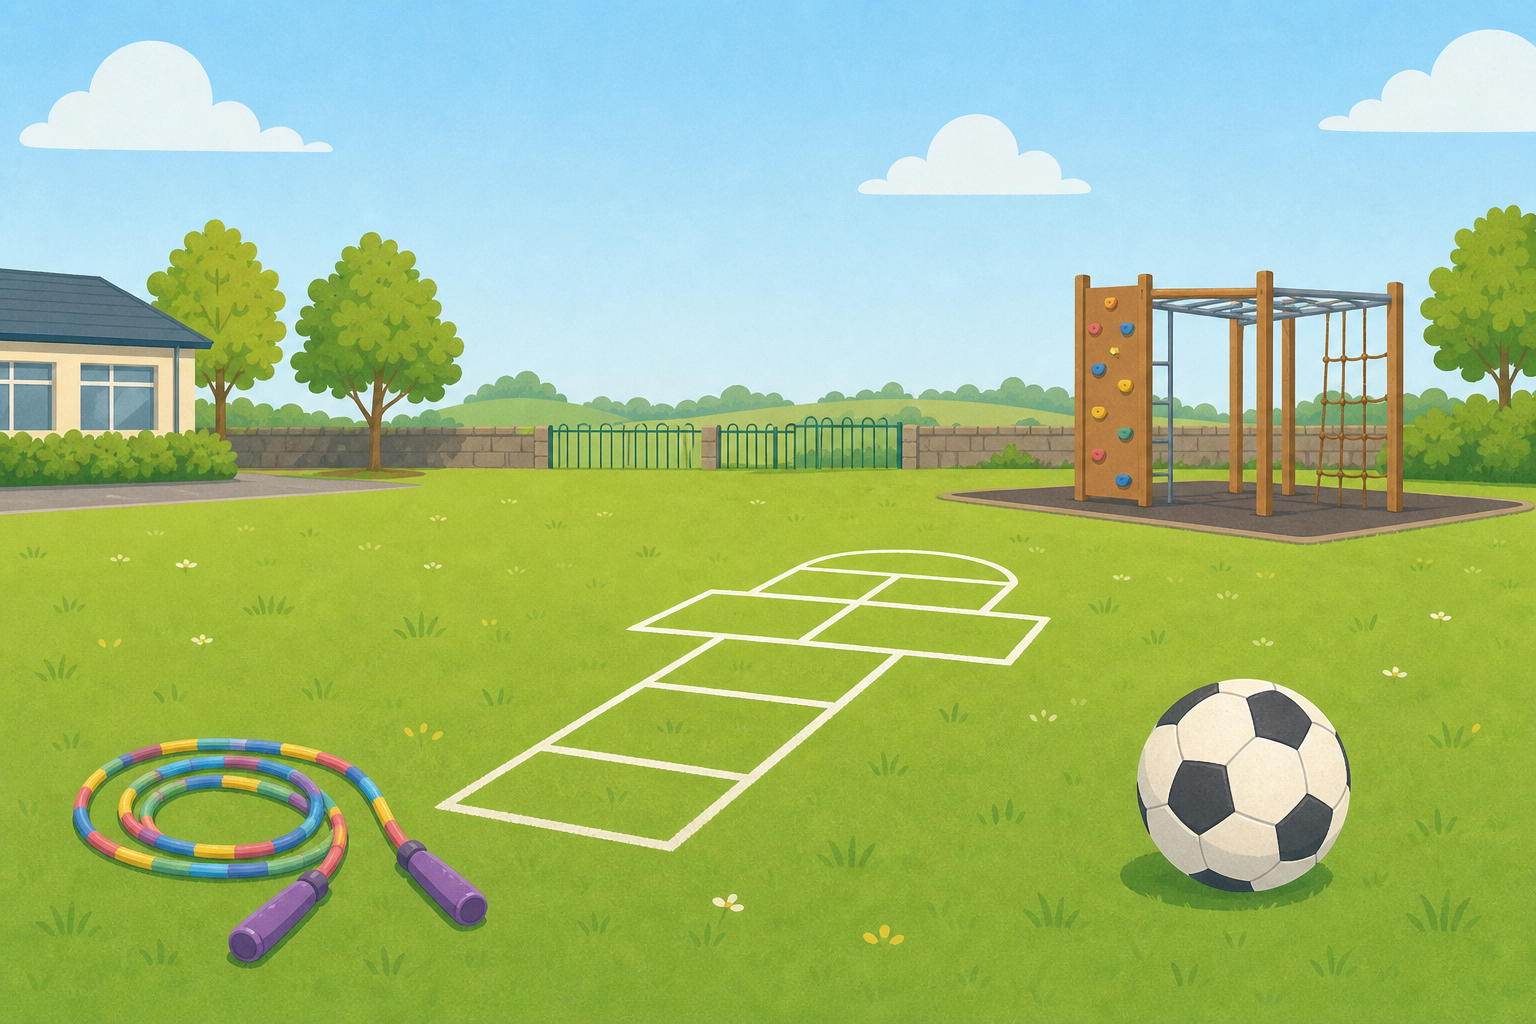
    Illustration for Getting StartedToday we are going to run a real survey on our own class, start to finish. Here is our question for today: what is your favourite playground game?

    Key point

    Before we count a single answer, make a prediction in your head: which game do you think will win?

    2 - Watch and Notice ~9 mins

    Watch how the same class survey becomes two things: first a tally, then a bar chart. On the tally, notice the gate-marks — every fifth mark is a bar drawn across the other four, so we can read totals fast. On the chart, notice that each bar's height is that category's count.

    3 - Try It Together ~10 mins

    Now we collect our own data live, all together on the board. Your job this time is to follow along and answer aloud — you write nothing yet, that comes next. We tally the class answers to favourite playground game — Chasing, Football, Skipping, Handball — one row at a time. When the tally is full, we read off the totals and say which game won.

    Favourite playground game

    4 - Comparing Two Classes: 6A and 6B ~5 mins

    Here is the same idea taken one step further. Two classes, 6A and 6B, were asked their favourite lunch. This chart shows two bars for each lunch, one for each class, and the colour key tells you which is which. It is just like our own survey, only comparing two classes side by side. Which lunch won in each class? Let's read it off the board together.

    Lunch choices: 6A and 6B

    5 - Set up Your Survey in Your Copy ~6 mins

    COPYBOOK MOMENT

    In your maths copy, write today's survey question, favourite playground game, and its four categories. Draw a tally frame with one row per category and copy in the totals we just counted together. Then sketch a small bar chart of those totals.

    Pupil practice
    Module 7 · Data, Chance and the Co-ordinate Plane Data & Chance
    Lesson 91 · Class Survey: Pose, Collect, Summarise, Present
    Download Activity Book page (PDF)
    123learn · Online learning platform

    Unlock the full learning experience

    You're previewing this lesson. Get full access to this lesson and hundreds more — each one ready to teach, with interactive activities, printable resources and pupil progress tracking built in.

    Hundreds of curriculum-aligned lessons
    Interactive activities in every lesson
    Printable resources & progress tracking
    Copyright Notice
    This lesson is copyright of Coding Ireland 2017 - 2025. Unauthorised use, copying or distribution is not allowed.
    🍪 Our website uses cookies to make your browsing experience better. By using our website you agree to our use of cookies. Learn more
