Mathematics
Intermediate
38 mins
Teacher/Student led
+80 XP
What you need:
IWB/Projector/Large Screen

Making a Block Graph with a Scale of One

Learn to build a block graph where each square represents one, and read bar heights against a numbered scale to show how many chose each option.
Teacher Class Feed

Load previous activity

    1 - Getting Started ~4 mins

    Here is a quick picture of our class's favourite pets, up on the board. Hands up: just by looking at it, which pet's bar is the tallest?

    A picture like this makes the winner easy to see at a glance. Today we learn how to build one of these ourselves, so that the tallest bar always shows the most.

    2 - Watch and Notice ~8 mins

    Now let's meet a second set of data, this time our class's favourite fruit. Look at these four bars on the block graph, a picture where each answer has a bar and the taller the bar, the more chose it. Each square up the side counts as one, so the top of each bar lands exactly on a number. Look at where each bar's top sits, and notice the empty bar that reaches zero.

    3 - Try It Together ~8 mins

    Now you set the fruit bars we just watched. We build our class fruit graph together on the board. Set the apple bar to 5. Then set the banana bar to 8. Then set the orange bar to 3. Finally, leave the pear bar empty at 0. Before each bar, say where its top should land.

    Build our fruit graph

    4 - Sketch the Axes in Your Copy ~5 mins

    COPYBOOK MOMENT

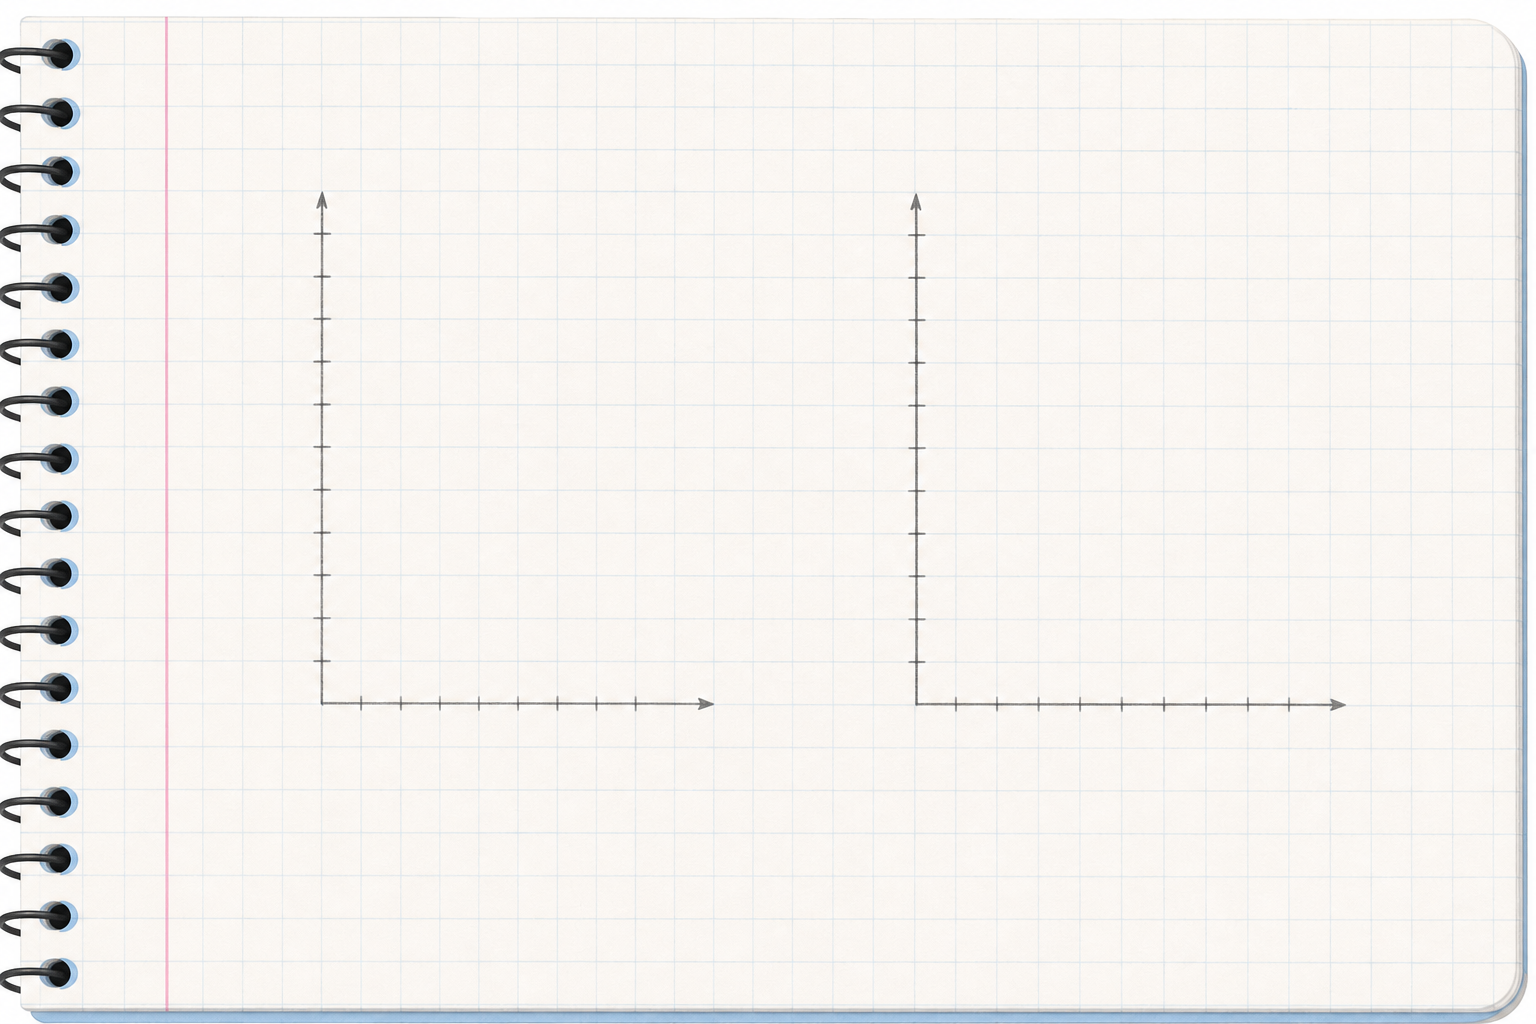
    Illustration for Sketch the Axes in Your CopyIn your maths copy on squared paper, draw the side line and the bottom line for a block graph. Label the side line so one square stands for one. Then sketch the first bar from our class data, making the bar's top land exactly on the right line.

    5 - Class Challenge ~8 mins

    Here is a new set of data, this time about favourite colours. We build four bars in turn, each one taller than the last. First set a bar for 3. Then set a bar for 6. Then set a bar for 8. Finally set a bar for 10, and remember to keep counting single squares. Before each one, point to the line where its top must land, then check.

    Build the bars

    Pupil practice
    Module 9 · Data and Chance Mixed
    Lesson 98 · Making a Block Graph with a Scale of One
    Download Activity Book page (PDF)
    123learn · Online learning platform

    Unlock the full learning experience

    You're previewing this lesson. Get full access to this lesson and hundreds more — each one ready to teach, with interactive activities, printable resources and pupil progress tracking built in.

    Hundreds of curriculum-aligned lessons
    Interactive activities in every lesson
    Printable resources & progress tracking
    Copyright Notice
    This lesson is copyright of Coding Ireland 2017 - 2025. Unauthorised use, copying or distribution is not allowed.
    🍪 Our website uses cookies to make your browsing experience better. By using our website you agree to our use of cookies. Learn more
