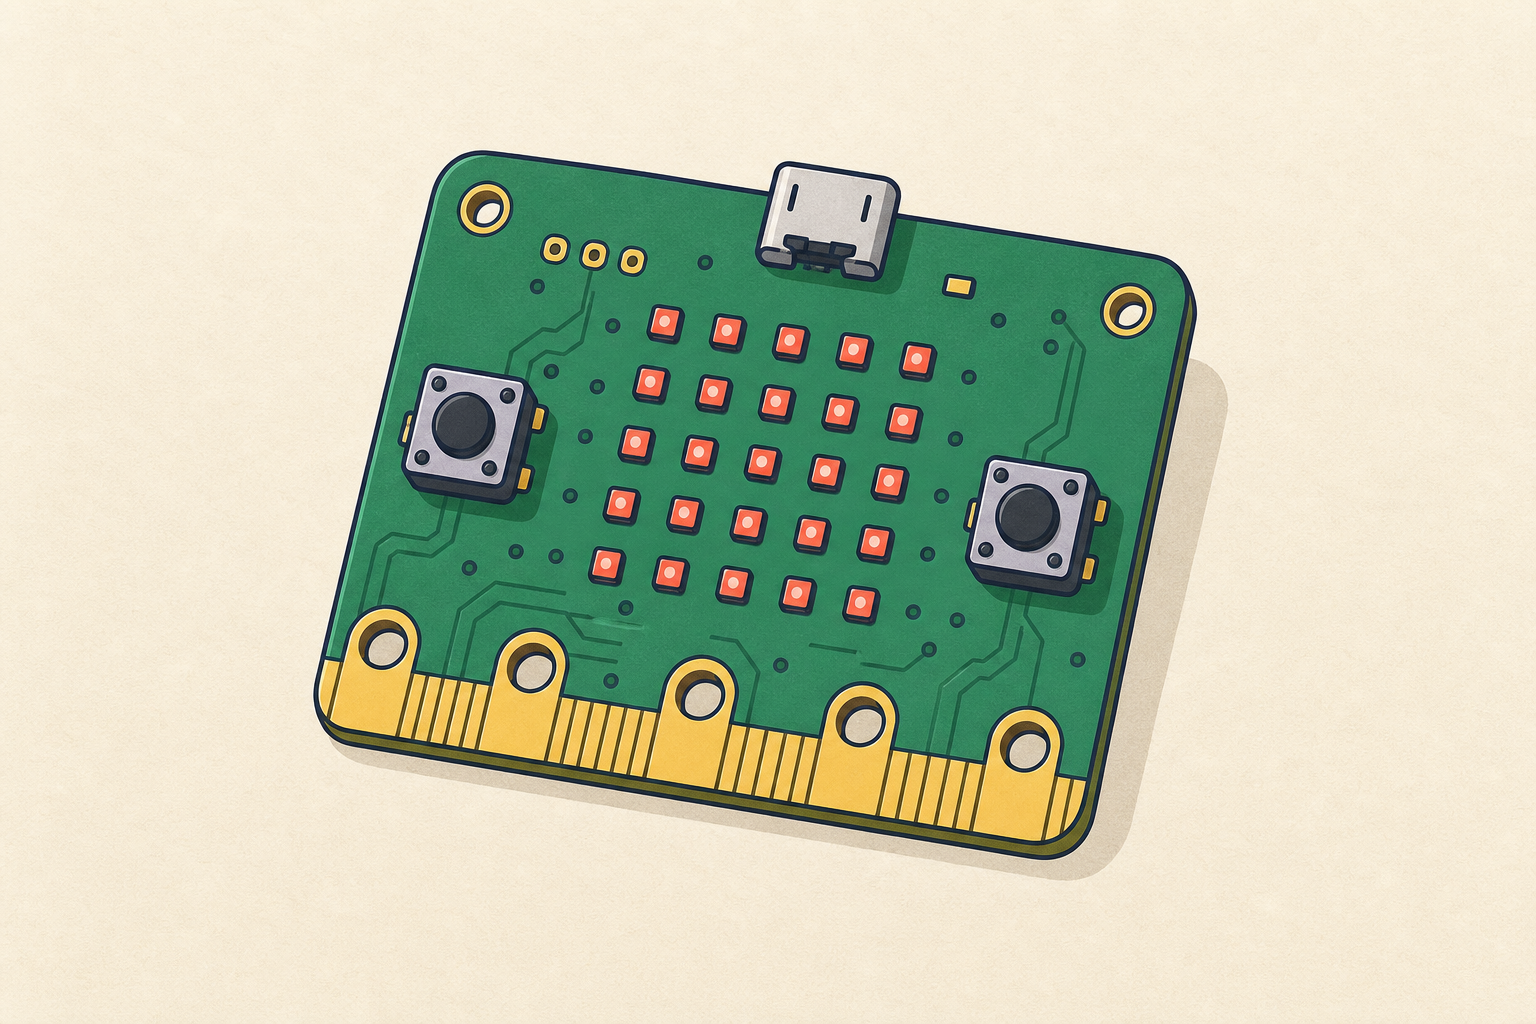
People who work with sensors — weather stations, hospital monitors, farm soil probes — rarely rely on a single reading. They take the same measurement again and again over time and watch how it changes. That's how you tell whether something is warming up, cooling down or holding steady.
Today you'll turn your micro:bit into one of those instruments. First you'll show a reading on the screen, then you'll make it draw a live graph so you can watch the numbers rise and fall as the world around the board changes. Watch the board first as each piece is modelled, then build it with your partner and run it to see what happens.
Open on the IWB and set the scene: today we're not just taking one reading, we're watching readings change over time like real sensor systems do. Have micro:bits and leads distributed. Tell pupils to watch you model the first piece before they build in pairs, and let them know they'll download to the physical board to test for real. Safety: keep leads tidy under desks.
Go to the makecode.microbit.org website and create a new project.
Go to the Makecode.com Microbit website using the link below and click on the 'New Project' button underneath the 'My Projects' heading.
https://makecode.microbit.org/
Install the micro:bit app on your iPad or tablet.
Open the app, tap 'Create code' and then create a new project.

Model opening a new project on the IWB so everyone starts from a clean workspace. Ask: 'What do we do before writing any new program?' Watch for pupils editing an old project — check each pair has a fresh, empty workspace before moving on.
The first sensor that we'll look at is the light level sensor. This senses how much light from the surrounding environment is hitting the front of the Microbit.
This number can be between 0 (black) and 255 (white).
Let's display the light level on the Microbit now.
basic.forever(function () {
basic.showNumber(input.lightLevel())
})You can change the amount of light on the Microbit simulator by using the yellow/grey circle in the top left corner (watch the gif for this step).Make sure to download the code on to your Microbit to test it out for real by shining more/less light on it!
Give your project a name and send it to your Microbit by following these steps:

Model this first block on the board and demonstrate changing the light with the yellow/grey circle on the simulator so pupils see the number react. Key question: 'What number means dark and what means bright?' Common issue: pupils forget to download, so shining a light on the real board does nothing — remind them to download after every change. Support: leave pupils happy on the simulator for now. Safety: no shining torches into eyes.
We'll now do something a bit more interesting using the light level. We can view the light level on a graph that will illustrate the changes in light.
basic.forever(function () {
led.plotBarGraph(
input.lightLevel(),
255
)
})
You can view the graph on the simulator on your computer (click the "show data" button under the Microbit). Change the light level on the Microbit simulator and see how the graph changes!
Then, download the code on to your Microbit.
This is the heart of the lesson — model swapping the display for the bar-graph block and point out the <strong>Show data</strong> button under the simulator. Ask: 'How is the graph telling us something the single number wasn't?' Watch for a flat or full graph — that's the <em>up to</em> value not matching the range. Extension: ask pupils to describe out loud what a rising bar means.
Now, we are going to change the code to make use of the other sensors on the Microbit. After each step you can test your change on both the simulator and your Microbit after you download the code.
Try to think about what the "up to" value should be in the plot graph code block during each step. If you are unsure then you can just put in 1023 (this is the maximum the Microbit allows).
All of these sensor blocks can be found in the Input block section.
Steps:
basic.forever(function () {
led.plotBarGraph(
input.temperature(),
50
)
})
basic.forever(function () {
led.plotBarGraph(
input.compassHeading(),
359
)
})
basic.forever(function () {
led.plotBarGraph(
input.acceleration(Dimension.X),
1023
)
})
basic.forever(function () {
led.plotBarGraph(
input.magneticForce(Dimension.X),
1023
)
})
basic.forever(function () {
led.plotBarGraph(
input.soundLevel(),
255
)
})
Let pupils choose another sensor, e.g. temperature. Before they run it, ask them to predict a sensible <em>up to</em> value — this builds the trend-thinking. Cupping the micro:bit in warm hands makes the graph climb; letting go makes it fall, a clear live trend. Bug to watch: mismatched maximum flattens the graph; nudge them to the suggested value or 1023. Safety: hands only — don't warm the board with anything else.
You're previewing this lesson. Get full access to this lesson and hundreds more — each one ready to teach, with interactive activities, printable resources and pupil progress tracking built in.