Warning: Your screen size is quite small for viewing this. Rotate your device into landscape mode if you can.
Your turn
Your teacher is running this lesson on the board. Here is the part you can try yourself.
Bar chart builder
1 - Start ~4 mins
2 - Examine ~7 mins
An ecological footprint is a rough measure of how much productive land and sea a way of living needs for food, materials, energy and dealing with waste. It is a model, not a moral score. A single total also hides the shape underneath: two people can share the same total while one uses most of it on travel and the other on food. The categories matter as much as the sum. Today's four categories are Travel, Food, Energy and Waste. You will score each one yourself, then show the pattern as a chart.
3 - Build Your Footprint Chart ~21 mins
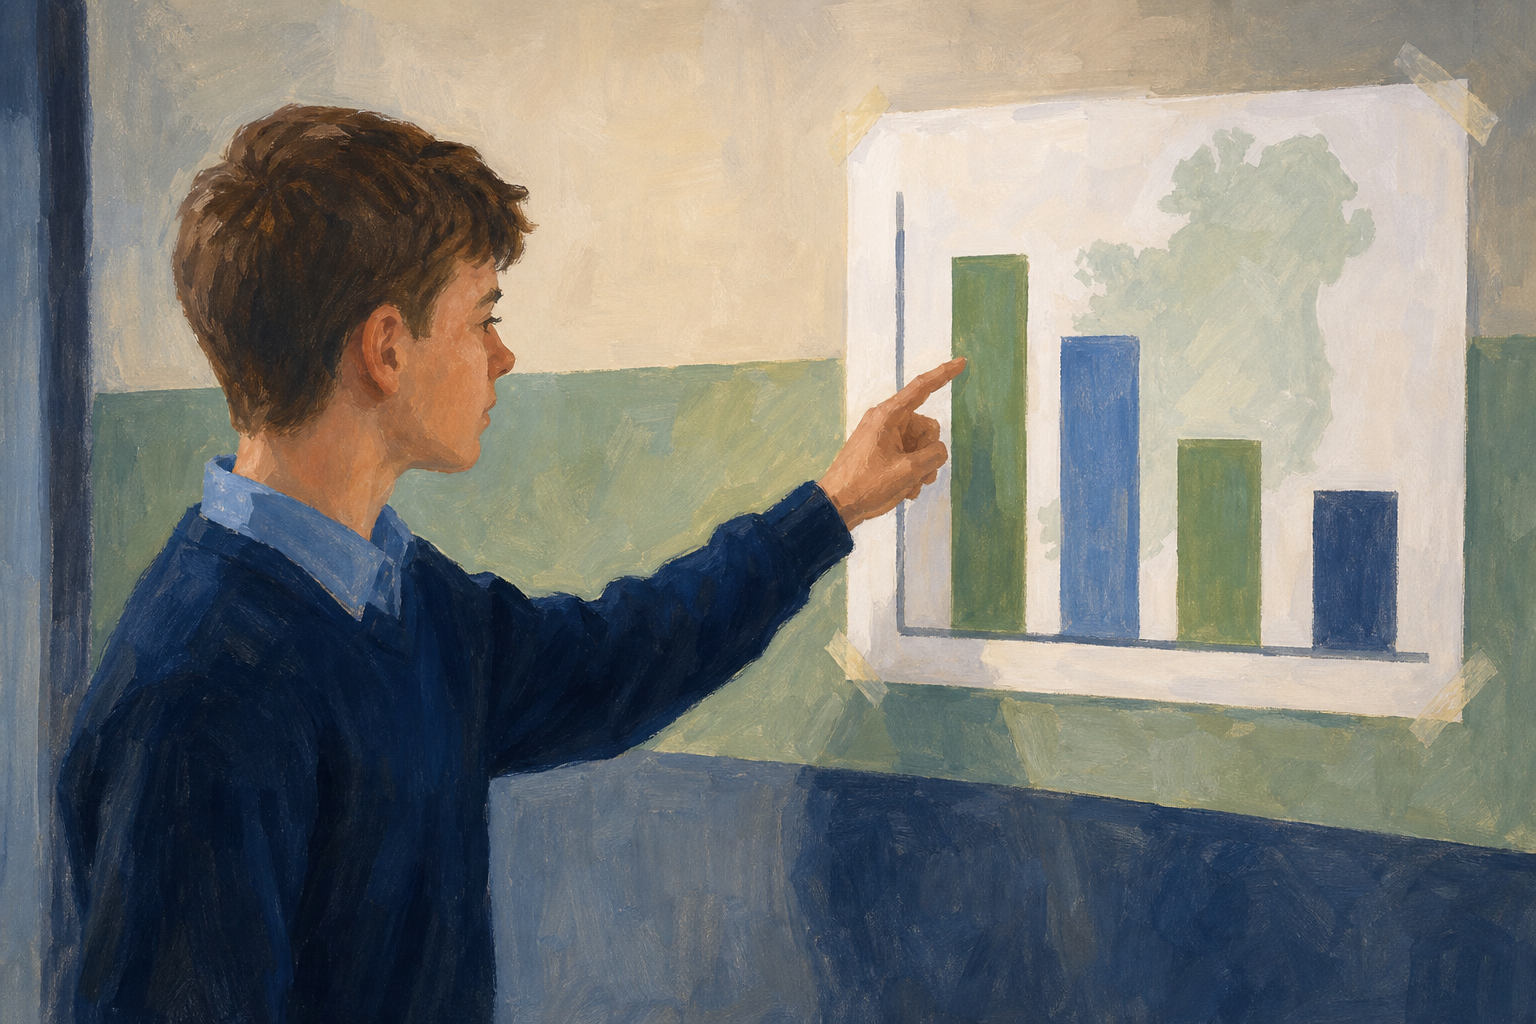
Score your typical week on the card for Travel, Food, Energy and Waste (each from 1 to 10). Add the four scores only after you have chosen them. Then drag each bar on the chart below to match your score. Sit with a partner and compare shapes first: where is each chart tall, and where is it low? Only then look at totals. Be ready if called to show a pair of charts with a similar total and a different shape, or a similar shape and a different total.
4 - Make Sense of It ~5 mins
Look back at your four bars. Write two short lines only. Line one: the one category you could genuinely change in the next month, and why that one. Line two: the one category you could not honestly change much right now, and why. Be ready to read one of the lines if asked. No score is better or worse here; the point is to read your own chart honestly.
5 - What You Covered ~3 mins
You can now say what an ecological footprint is trying to measure, and what a single total leaves out. You scored Travel, Food, Energy and Waste for a typical week, built a bar chart of that data, and used the shape of the chart to spot what a total alone would hide. You also named one category you could change and one you could not.
123learn · Online learning platform
Unlock the full learning experience
You're previewing this lesson. Get full access to this lesson and hundreds more — each one ready to teach, with interactive activities, printable resources and pupil progress tracking built in.
Hundreds of curriculum-aligned lessons
Interactive activities in every lesson
Printable resources & progress tracking
Copyright Notice
This lesson is copyright of Coding Ireland 2017 - 2026. Unauthorised use, copying or distribution is not allowed.
This lesson is copyright of Coding Ireland 2017 - 2026. Unauthorised use, copying or distribution is not allowed.