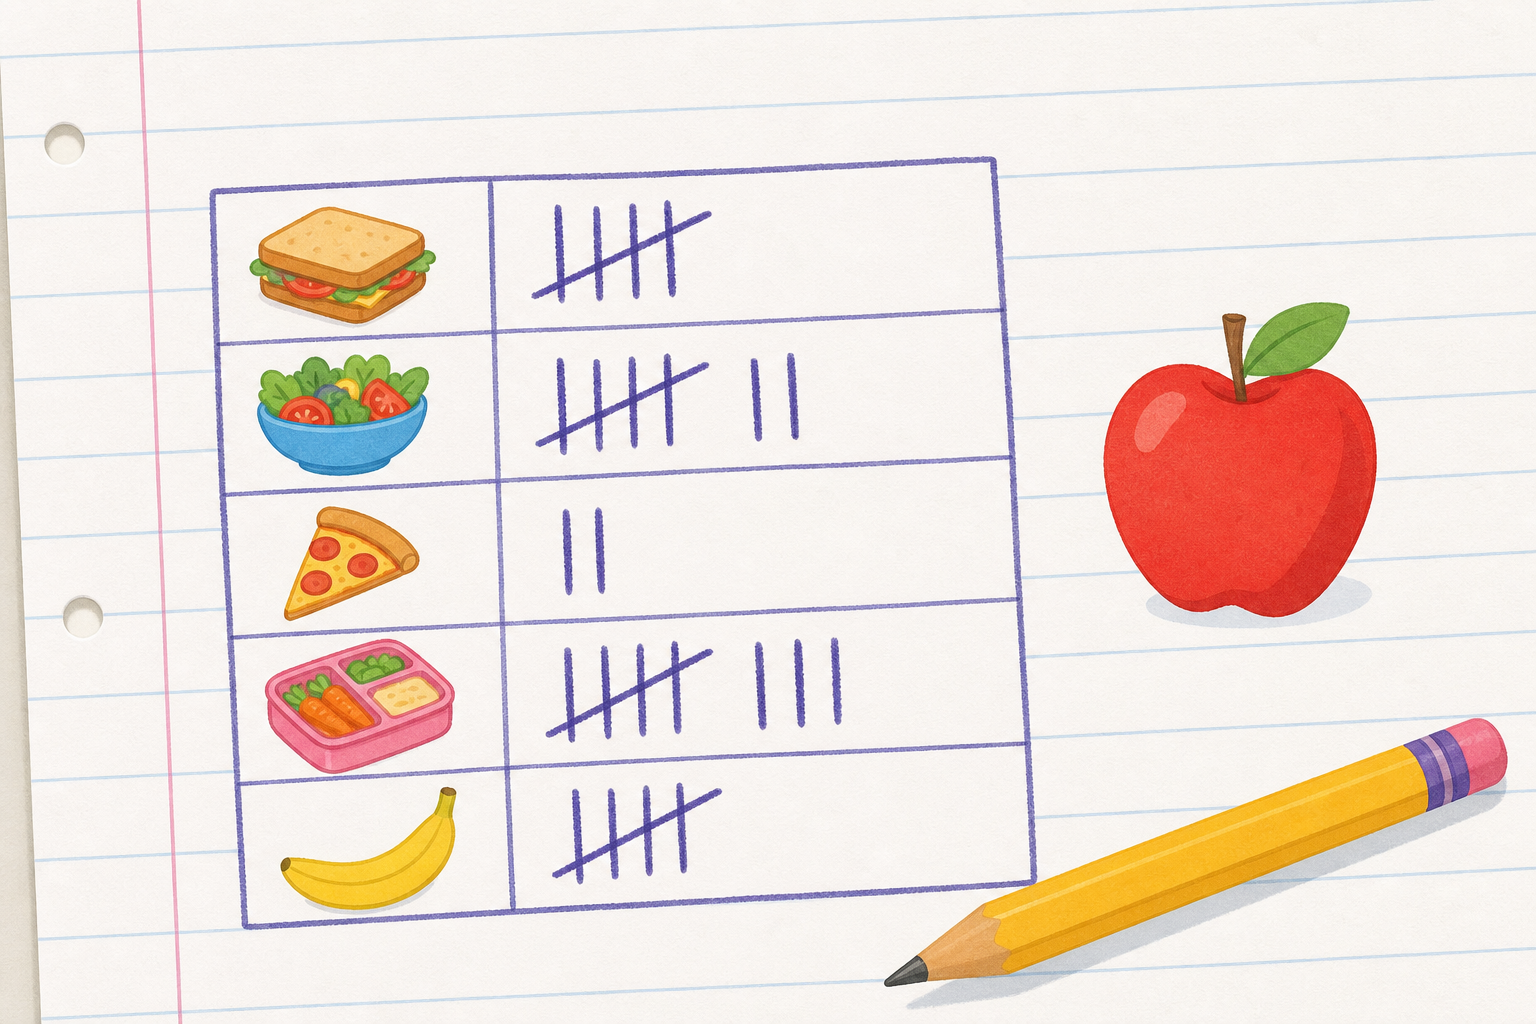
Look at this tally of our class's favourite school lunch, and look at this one apple picture beside it. If one apple picture means one pupil, how many apple pictures will the most popular lunch need?
Have a guess before we count.
Show a simple class tally and one fruit icon as pupils settle. Take two or three hands-up answers, not open call-outs. Keep it quick — this is just to plant the idea that one picture can stand for one pupil.
Look at these pictograms, one row at a time. Each picture stands for exactly one pupil, so a longer row means more pupils chose it. Count the pictures in each row.
Row of 4: count the pictures aloud, one two three four; one picture means one pupil.
Row of 7: count to seven; ask why this row is longer.
Empty row: count is zero, no pictures; stress it still needs its label, as pupils often drop it.
Two rows side by side (row of 4, row of 7): run a finger along the start line, both rows begin level here. This is the make-or-break idea for fair comparison, the longer row only means more when both start level.
Let's build a pictogram from our own class data, putting the right number of pictures in each row. One picture means one pupil.
We will check each row by counting the pictures and matching them to the number that voted.
This round is for talking it through together — pupils take turns at the board and the class agrees or corrects out loud.
The activity opens with a sensible default break-time game dataset (Tag 5, Skipping 3, Football 7) so you can run it straight away. If your class's own vote is ready, you can replace these counts with the real numbers — that is the better path, but the default is a complete fallback if real data isn't to hand.
Have a pupil place the symbols for one category, then ask the class: does the count of pictures match the number that voted? Rotate pupils across the categories. Watch for rows not starting level — nudge each new row back to the start line.
In your maths copy, draw a simple symbol key at the top: one picture, then = 1 pupil. Choose any easy picture to draw, like a small circle or a smiley face.
Then draw the rows for two categories from our class data, using that same picture. Keep both rows starting from the same line.
Walk the room glancing for two things — every symbol the same size, and both rows starting level. This is whole-class copybook practice, not marking. No need to collect or correct individually.
Now let's read some pictograms together. Each picture still means one pupil. For each chart I'll ask you something different — how many are in a row, which row has the most, how many there are altogether, and how many more one row has than another.
Before you compare two rows, check that both rows start at the same line.
These are the practice questions — pupils take turns at the board, read each chart, and the class confirms before moving on. Keep the board work brisk rather than over-explaining.
For each challenge a pupil builds the answer row with pictures on the board; press Check together and let the class confirm. Use the callout did you check both rows start at the same line before comparing? on the difference question, where pupils most often misjudge a longer-but-fewer row.
You're previewing this lesson. Get full access to this lesson and hundreds more — each one ready to teach, with interactive activities, printable resources and pupil progress tracking built in.