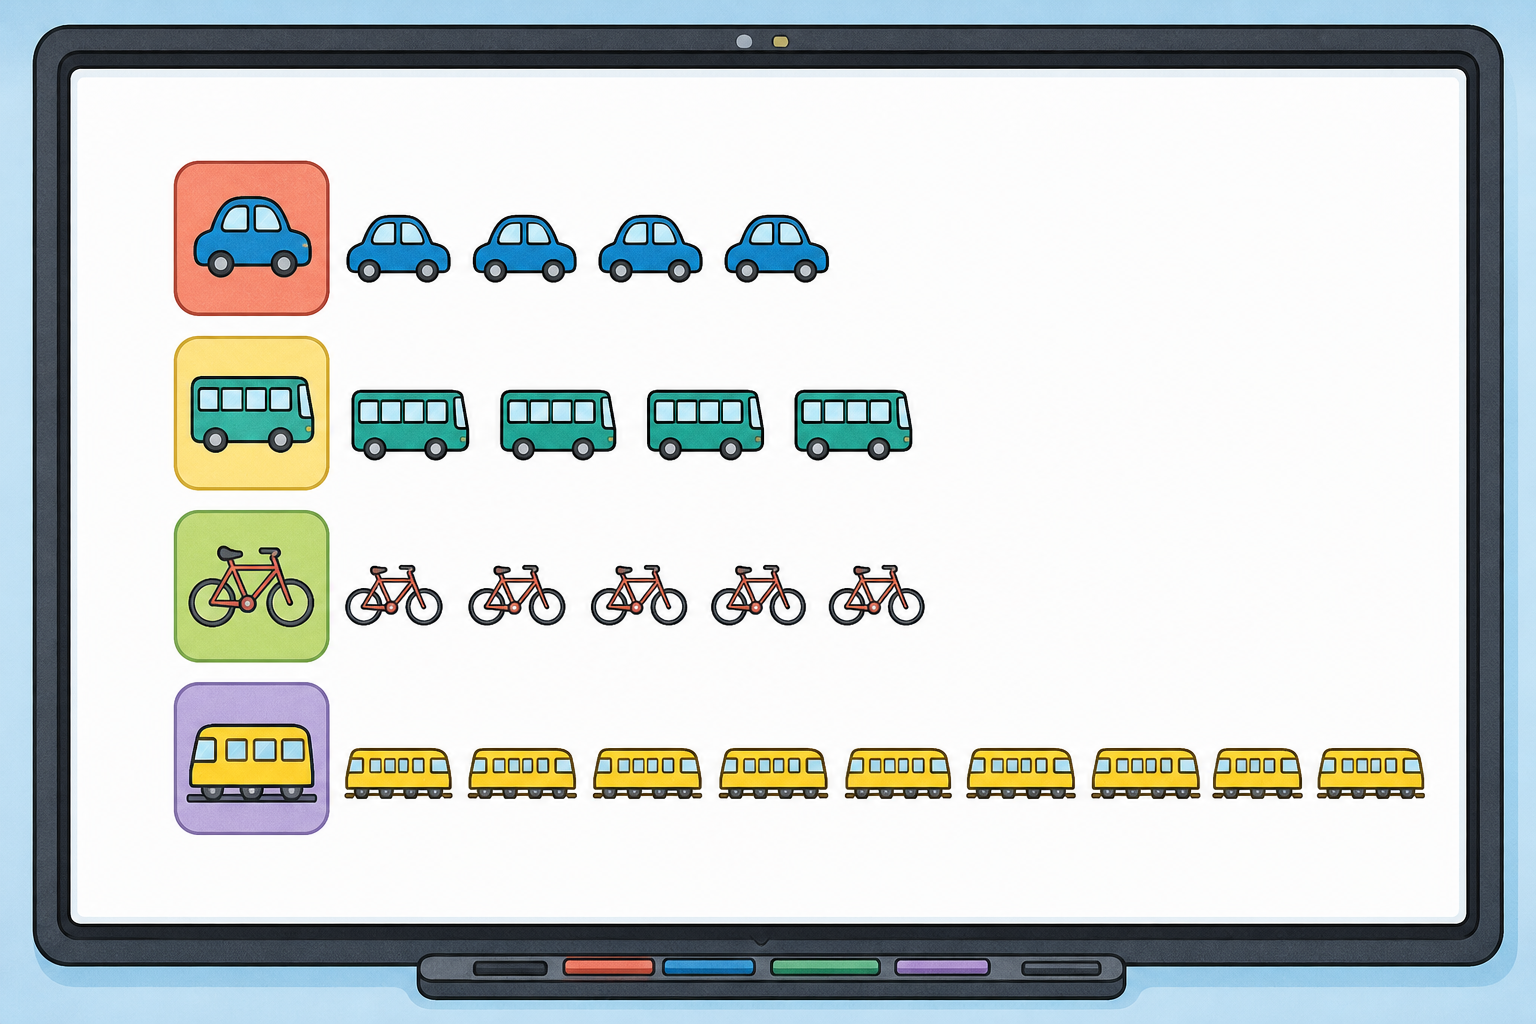
Here is a pictogram showing how the children in one class got to school. Each little picture stands for one child.
Have a good look: which way did most children travel? Can you tell just by glancing, before we count anything?
Take two or three hands-up answers, not open call-outs. Push for how they knew: the answer is the longest row, not a guess.
Don't count exact numbers yet — that is the next step. Here we just want pupils noticing that a longer row means more.
This pictogram shows how our class got to school — each icon stands for one child. We will read it four ways: the most, the least, how many more walked than cycled, and how many altogether. Have a quiet guess and put a hand up before each one.
Display snapshot — point at rows, don't drag. Run the four beats separately, taking two hands-up predictions before each reveal so the back stays with you.
Most: trace the longest row — Car, 12, the most common way.
Least: trace the shortest row — Cycle, 3.
How many more walked than cycled: finger under Walk (8) and Cycle (3) together, count the icons sticking out past cycle — 5. This is the make-or-break idea; don't rush it.
Total: count every icon across all four rows — 8 + 3 + 5 + 12 = 28.
Now we read a new pictogram together. It shows the pets the class have at home, one icon for each pet.
We will answer these in order: which pet is the most, which is the least, how many more have a dog than a fish, and how many pets altogether. When a classmate is at the board, everyone else says the answer together before we check it.
This is a Try Together round: we work through it as a class on the board, thinking aloud together, with pupils taking turns to answer at the board and the class agreeing each answer.
Load the pets pictogram and ask one reading question at a time. Pupils take turns at the board, and the class agrees or corrects out loud before each check. A pupil comes up and traces the row they are counting so the class can follow the finger.
Answer these three questions about the pets pictogram in your maths copy. Write the total as a number.
Walk the room glancing at the answers — this is whole-class copybook practice, not marking. The most and least answers should be group names; only the total is a number. Watch for pupils who write a category name for the total instead of a number.
Today we work through these readings together on the board. First we find the most, then the least, then how many more the first row has than the second row, and finally the total of every row. We build one pictogram at a time, so the one being built is the one we are working on. Each pictogram gets a little harder — the last one has a total to add across four rows.
This is the Class Challenge: pupils take turns answering at the board while the whole class checks each answer together before we move on.
Pupils take turns at the board, check each answer, and the class confirms before moving on. Keep the board work brisk rather than over-explaining.
You're previewing this lesson. Get full access to this lesson and hundreds more — each one ready to teach, with interactive activities, printable resources and pupil progress tracking built in.