Today you will
- practise on a sample business called Harbour Craft Stickers
- build one workbook for your own project, with three sheets, money columns, a chart and a few sentences about it
- save it as {{code:sm3_unit2_polished}}, your best Unit 2 file
Warm-up
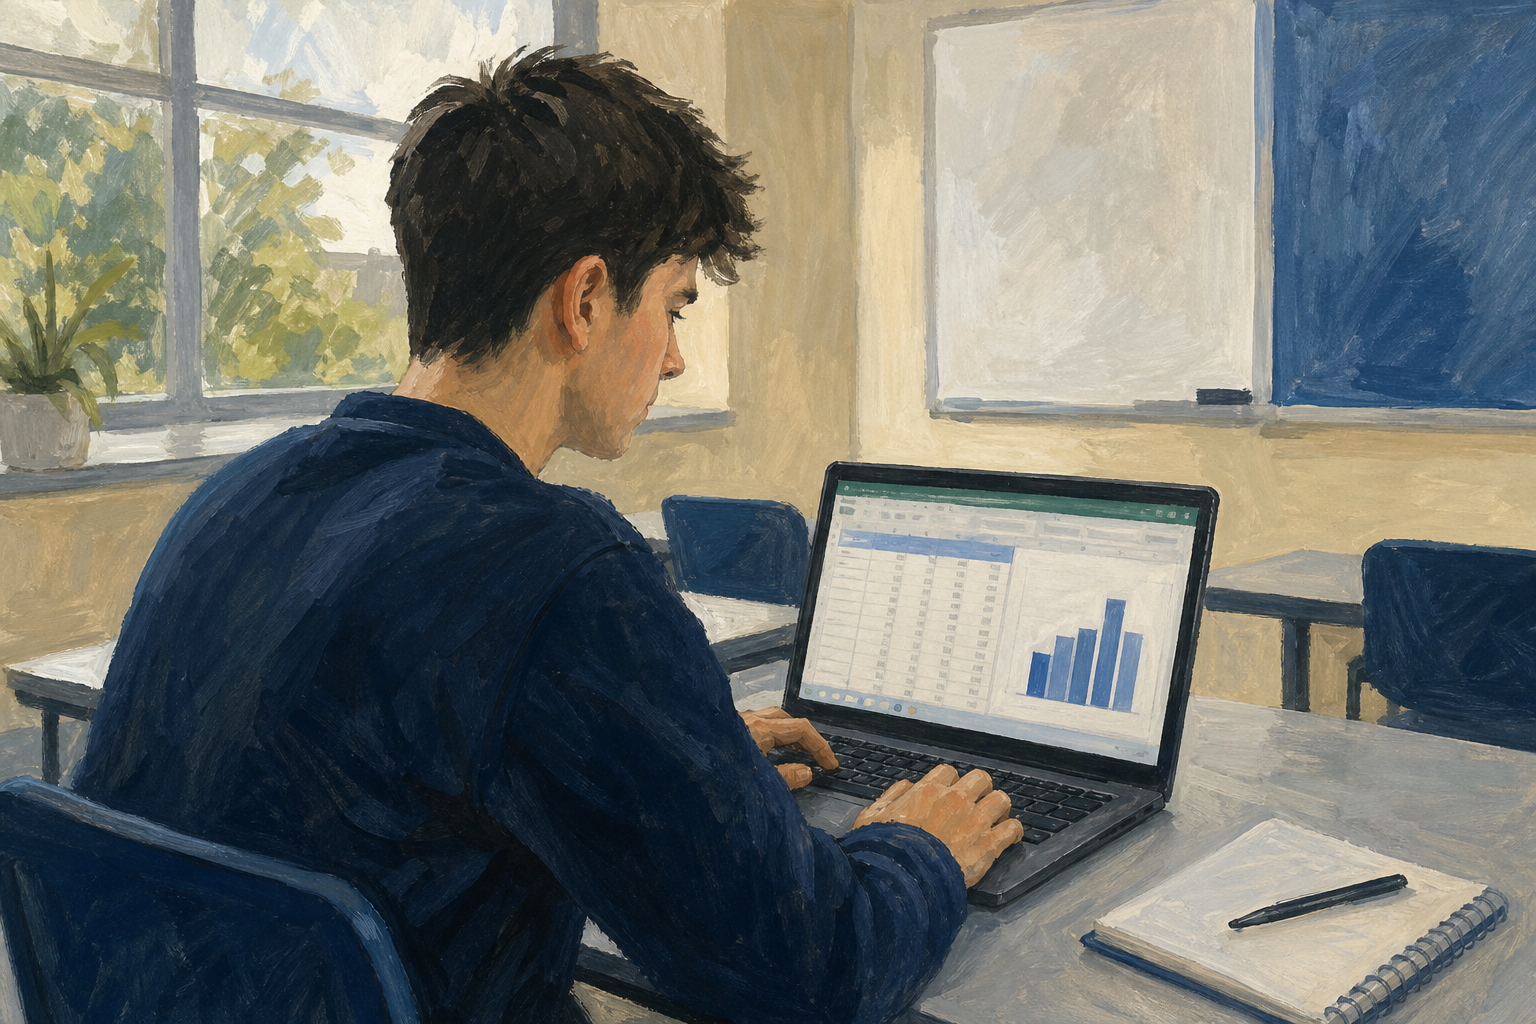 Think of one Unit 2 spreadsheet that works well for your project, and one that still feels messy. Which one would you show a supervisor first?
A polished workbook has three sheets, working formulas, a chart and a short explanation.
VAT is a tax added to a price. The net price plus VAT gives the gross price the customer pays.
An interpretation is three or four sentences saying what the chart shows and what you will do.
An error value like {{code:#DIV/0!}} means a formula is broken, so fix it before you finish.
Example
A club crest pack costs €4.00 net. VAT at 23% is €0.92, so the gross price is €4.92.
You will polish the Harbour Craft Stickers practice workbook and save it as {{code:sm3_unit2_workshop}}. Copy the table below and paste it into {{cell:A1}} on your {{code:data}} sheet. Then follow the steps in the box below.
Harbour Craft Stickers starter
| Item | Net (€) | VAT (€) | Gross (€) | Qty sold | Gross total (€) |
|---|---|---|---|---|---|
| Club crest pack | 4.00 | 30 | |||
| County colours set | 5.00 | 20 | |||
| Custom name strip | 10.00 | 15 | |||
| Phone case decal | 2.00 | 25 | |||
| Laptop skin mini | 8.00 | 12 |
Stuck?
- If your average shows {{code:#DIV/0!}}, check the range covers cells that have numbers in them.
- If COUNT shows 0, point it at the quantity column {{range:E2:E6}}, not the product names.
- If your chart looks wrong, select the names and the totals together before you insert it.
Independent Practice
- In {{code:sm3}}, make a new spreadsheet called {{code:sm3_unit2_polished}}.
- Make three sheets called {{code:data}}, {{code:summary}} and {{code:charts}}.
- On {{code:data}}, add five rows from your own project, like sales, match stats or Work Experience hours.
- On {{code:summary}}, add {{formula:SUM}} and {{formula:AVERAGE}} formulas, and format money as euro.
- Make one chart and write 3 or 4 sentences saying what it shows and what you will do.
- {{code:sm3_unit2_polished}} is saved in {{code:sm3}} with three named sheets.
- Money looks like money, and totals change when I change a number.
- My chart has a short explanation with one decision for my project.
- No error values are showing.
Unlock the full learning experience
You're previewing this lesson. Get full access to this lesson and hundreds more — each one ready to teach, with interactive activities, printable resources and pupil progress tracking built in.
This lesson is copyright of Coding Ireland 2017 - 2026. Unauthorised use, copying or distribution is not allowed.