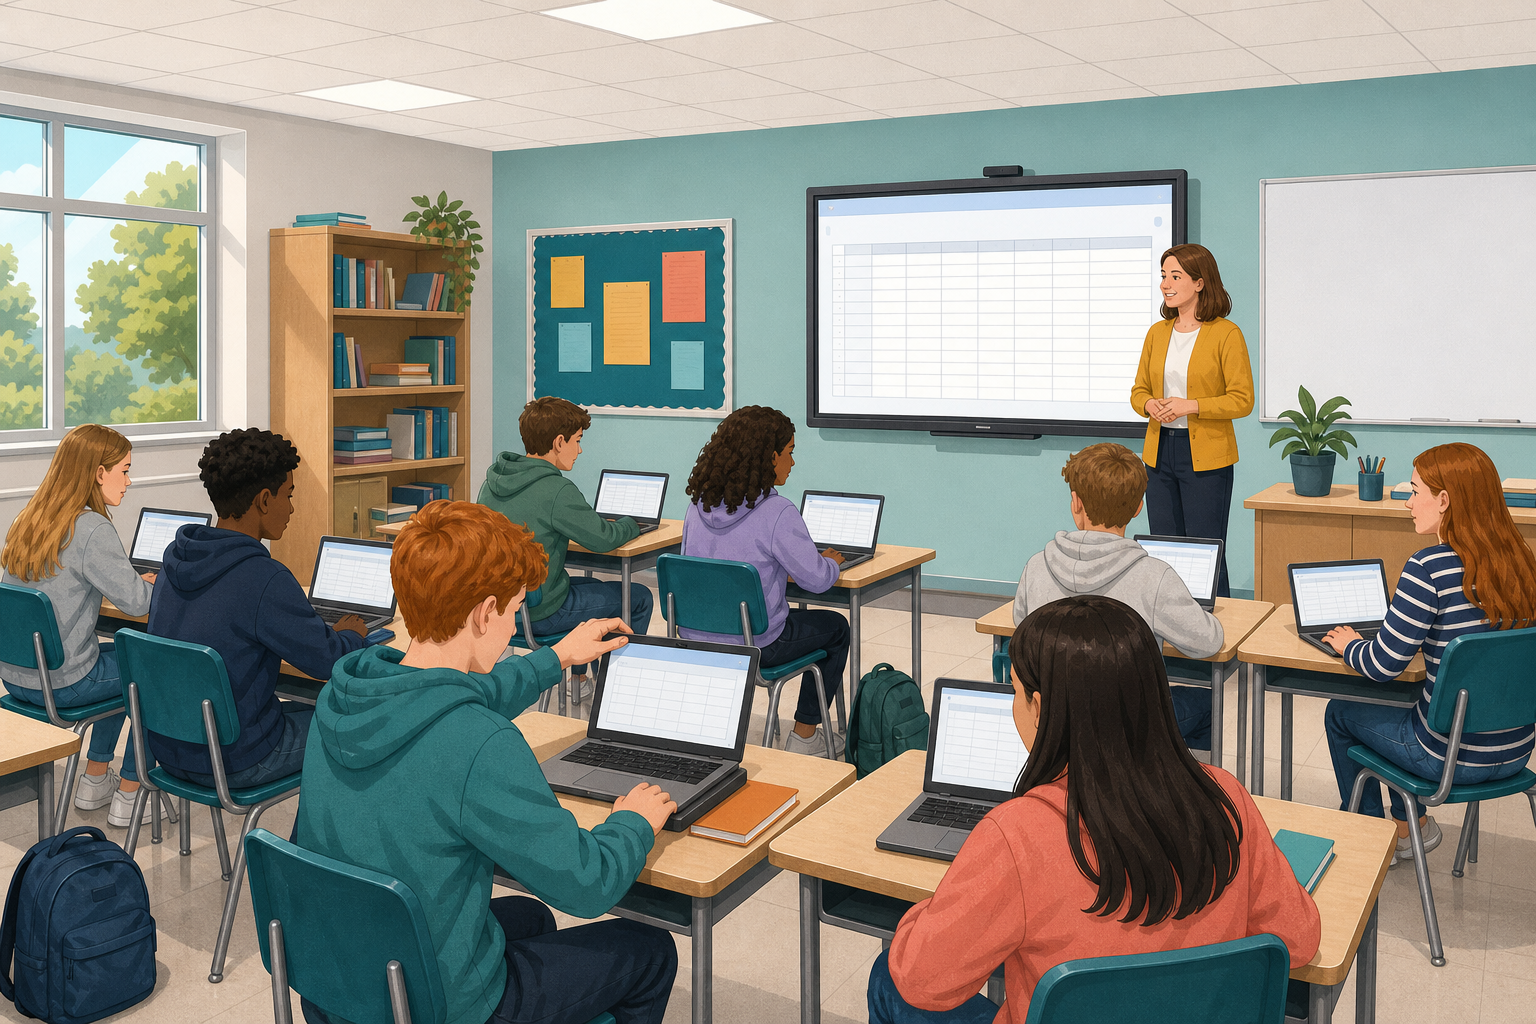
 Earlier in the course you compared sources and wrote down why you trusted them. Today you will put that comparison into a spreadsheet. You will:
- set up the columns;
- type in your sources, one on each row;
- freeze the top row so it always stays in view;
- sort and filter the rows to answer a question about your sources.
You need your school Microsoft or Google account. The steps cover both Excel and Google Sheets.
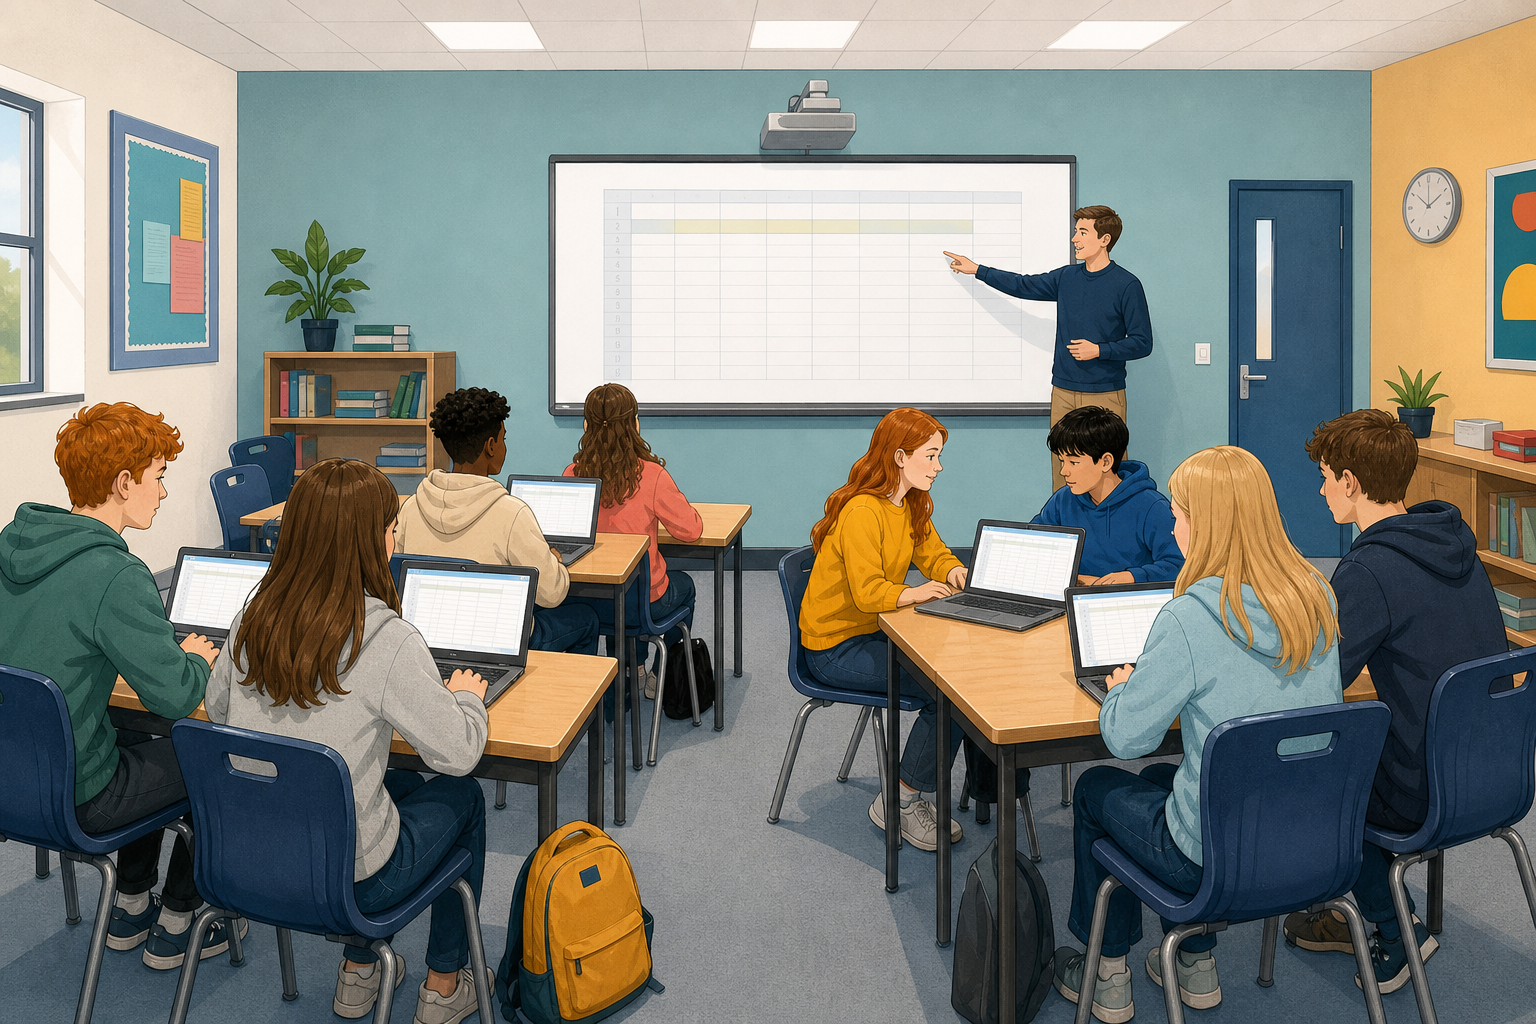 In a spreadsheet, each row is one source and each column is one fact about it. When you have more than a few sources, sorting or filtering them is quicker than rewriting a long list.

You score the four tests yourself, using Yes, No or Partial:
| Test | The question it asks |
|---|---|
| Purpose clear? | Can you tell why this was published? |
| Accurate? | Do the claims look careful and supported? |
| Current? | Is the date recent enough for this topic? |
| Cross-checked? | Have you seen the same idea in another source you trust? |
Your log may only have titles and a note on trust. That is fine, because you will score each source again here.
Follow the steps in the activity below to build your spreadsheet. The activity has one set of steps for Excel and another for Google Sheets, so make sure you follow the set for your app. Start with the three sample sources in the box, because the checks at the end of the activity use them. If you have your own sources from earlier work, add them on the rows underneath.
The two most important skills today are freezing the header row and filtering, so if you are short of time, you can skip making the columns wider. When you reach the end, save the file again.
Topic: Should secondary schools start later in the morning?
In the Source column, type just the short label, such as Sleep study.
1. Sleep study. Full title: Teen Sleep and School Start Times. Author: Dr A. Byrne, on a Health Board summary page. Date: 2024-03-12. Score all four tests Yes.
2. Forum post. Full title: Late Starts Ruin Everything. Author: anonymous forum post. Date: 2019-11-02. Score all four tests No.
3. Parent survey. Full title: Parent Survey on Bell Times. Author: Greenfield Parents Association. Date: 2023-09-18. Score Purpose clear and Current as Yes. Score Accurate and Cross-checked as Partial.
Now add more sources to your table and use a filter to answer a real question about them.
- Add at least one more source row, or two if you finish early, from earlier comparison work or your research log. If your log only has a title and a note on trust, look at the source again for the author and date, and score the tests yourself.
- If you have no earlier sources, make up one realistic row about school start times. Give it the scores you think a real source like that would get. You can also use a starter title from the box and score it yourself.
- Turn on a filter and use it to answer one question about the whole set, such as "Which sources fail Current?" or "Which ones pass every test?"
- Write your question and a one-line answer under the table or beside it. Then save the file the class way.
(4) Irish Times opinion on school start times. Author: newspaper columnist. Date: 2022-01-15.
(5) HSE teen sleep leaflet. Author: HSE. Date: 2021-06-01.
(6) Student council blog post. Author: school council. Date: 2024-02-20.
Before you finish, check that:
- your table has at least four source rows;
- the header row stays frozen when you scroll;
- your filter answers the question you asked;
- your question and answer are beside the table;
- the file is saved where the class can find it.
A spreadsheet keeps your scores in order, but it does not decide if a source is trustworthy. You still decide that with your checklist.
The table lets you:
- sort by date to see quickly which sources are current and which are old;
- filter by scores to hide the sources that passed and look at the ones that did not;
- spot patterns across your sources that a long list hides.
What did your table show you that was hard to see in your research log?
Unlock the full learning experience
You're previewing this lesson. Get full access to this lesson and hundreds more — each one ready to teach, with interactive activities, printable resources and pupil progress tracking built in.
This lesson is copyright of Coding Ireland 2017 - 2026. Unauthorised use, copying or distribution is not allowed.